

More than 2,000 demographers are in Denver this week for the Population Association of America’s annual meeting, where they will discuss topics ranging from the changing family to international migration flows. Ahead of the meeting, here are some important recent demographic findings from Pew Research Center:
Millennials are projected to outnumber Baby Boomers next year. Numbering 71 million in 2016, Millennials in the United States are approaching Baby Boomers (74 million) in population and are projected to surpass them as the nation’s largest living adult generation in 2019. The Millennial generation, defined as Americans born from 1981 to 1996, corresponds to adults ages 22 to 37 in 2018.
Millennials are already the largest generation in the U.S. labor force, making up 35% of the total. (They surpassed Generation X in 2016.) Although Boomers formed the majority of the labor force in the early and mid-1980s, they made up just 25% of the total in 2017, as many older members of this generation reached retirement age.
In the political arena, the number of Millennials who are eligible to vote in the U.S. is approaching that of Boomers. As of November 2016, Millennials formed 27% of the voting-eligible population, while Boomers made up 31%. However, turnout rates in the 2016 election were lower for Millennials than Boomers (51% vs. 69%), meaning that Millennials accounted for a lower share of votes cast than their proportion of the electorate.
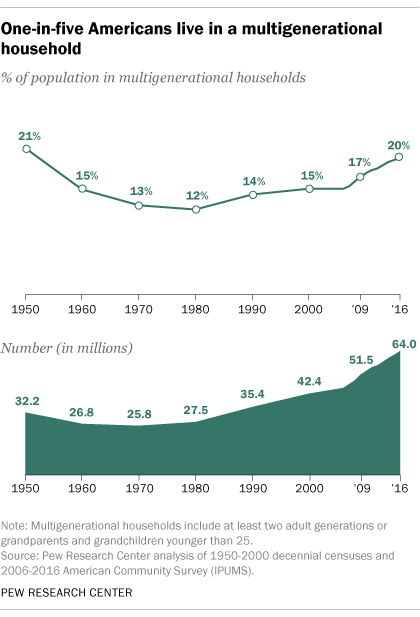
A record number of Americans live in multigenerational households, part of a broader trend toward more shared living. In 2016, a record 64 million people, or 20% of the U.S. population, lived with multiple generations under one roof, even with improvements in the U.S. economy since the Great Recession. Multigenerational family living is growing among nearly all U.S. racial groups, Hispanics, most age groups and both men and women. In recent years, young adults have edged out older Americans as the most likely age group to live in a multigenerational household, which we define as a household with two or more adult generations, or including grandparents and grandchildren younger than 25.
Meanwhile, 78.6 million adults, or about 32% of the U.S. adult population, were part of a shared household in 2017, reflecting another increasingly common living arrangement. A shared household is a household with at least one adult who is not the household head, the spouse or unmarried partner of the head, or an 18- to 24-year-old student. (Most multigenerational households are also shared households.)
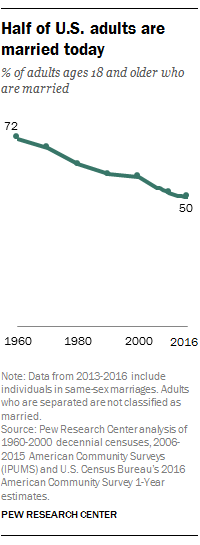
The institution of marriage continues to change. Half of U.S. adults today are married, a share that has remained relatively stable in recent years but is down significantly over previous decades. Cohabitation among unmarried partners is rising, including among a growing share of unmarried parents. The share of U.S. adults living without a spouse or partner has also increased, from 39% in 2007 to 42% in 2017.
The educational gap in marital status continues to grow. In 2015, among adults ages 25 and older, 65% of those with a four-year college degree were married, compared with 55% of those with some college education and 50% of those with no education beyond high school. Twenty-five years earlier, the marriage rate was above 60% for each group.
The share of adults reporting they are married also varies widely across U.S. religious groups, according to Pew Research Center’s 2014 Religious Landscape Study. For instance, six-in-ten or more Mormons, members of the Presbyterian Church (U.S.A.) and members of the Evangelical Lutheran Church in America are married, compared with fewer than four-in-ten atheists, agnostics and those who say their religion is “nothing in particular.”
Increasing shares of newlyweds have a spouse of a different race or ethnicity. In 2015, 17% of all U.S. newlyweds were intermarried, a more than fivefold increase since 1967. Among cohabiting U.S. adults, 18% were living with a partner of a different race or ethnicity. Patterns differ for racial and ethnic groups: Asians, for example, are more likely than whites to have a spouse or partner of a different race.
After decades of decline, motherhood and family size are ticking up in the U.S. Among women at the end of their childbearing years (ages 40 to 44), 86% had ever given birth by 2016, an increase from 80% in 2006 and about the same share as in the early 1990s. Women also are having more children: On average, women in 2016 had 2.07 children during their lives – up from 1.86 in 2006, the lowest average on record.
In addition, there has been a substantial increase in motherhood over the past two decades among women who have never been married. In 2014, more than half (55%) of women ages 40 to 44 who had never married had given birth – up from 31% in 1994.
Parenting is changing in America in other ways, too. Both fathers and mothers are spending more time caring for their children than in the past, even as mothers spend considerably more time working outside the home than they did in previous decades. For their part, 63% of fathers say they spend too little time with their children, mainly because of work obligations, according to a Pew Research Center survey conducted in 2017. Mothers are far more likely to say that they spend the right amount of time with their kids.
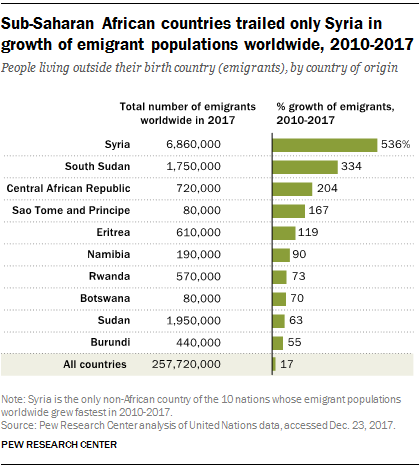
There are more than 250 million migrants worldwide, according to the latest data from the United Nations on the number of people living outside their birth countries in 2017 (see this updated interactive graphic). Sub-Saharan African nations account for eight of the 10 fastest growing international migrant populations since 2010. The number of migrants from each of these sub-Saharan countries grew by 50% or more between 2010 and 2017, significantly more than the 17% worldwide average over the same period. At least a million sub-Saharan Africans have moved to Europe since 2010. (Read this new Pew Research Center report for more information about the educational backgrounds of sub-Saharan African immigrants in Europe and the U.S.)
At the country level, Syria had the fastest-growing migrant population in the world, and Pew Research Center estimates that six-in-ten of the country’s pre-conflict population is displaced.
New refugee arrivals are down in the U.S. and their religious composition has changed. The number of refugee arrivals in the U.S. declined after 2016, even as the global refugee population increased. This decline was also widespread across the U.S., with declines in 46 states during the beginning part of fiscal 2017 (which began in October 2016). Furthermore, since 2016, the share of refugees who are Christian has risen, while the share who are Muslim has declined, according to a Pew Research Center analysis of U.S. State Department data.
Most refugees coming to the U.S. as of the end of fiscal 2017 were from the Middle East and Africa, although this has not always been the case. In fiscal 2002, Ukraine and Bosnia and Herzegovina accounted for the two largest countries by number of refugees coming to the U.S. And between fiscal 2008 and 2012, more than four-in-ten refugees admitted to the U.S. were from Asian countries.
International arrivals to the U.S. have risen among some groups. New foreign student enrollment at U.S. colleges and universities doubled between 2008 and 2016, from 179,000 to 364,000, far outpacing growth in overall college enrollment. Growth has been stronger at public schools than private schools. Students from China, India and South Korea accounted for more than half (54%) of all new foreign students pursuing higher education degrees in the U.S. in 2016.
In recent years, there also has been a rise in immigrants to the U.S. from El Salvador, Guatemala and Honduras, whose numbers rose by 25% from 2007 to 2015. The U.S. black immigrant population, though small, also is growing: There were 4.2 million black immigrants living in the U.S. in 2016, up fivefold since 1980.
Once arrived, rising shares of immigrants have become citizens, and naturalization rates are up among most of the largest immigrant groups. The number of naturalized immigrants grew from 14.4 million in 2005 to 19.8 million in 2015. Among origin countries, Ecuador and India had the largest increases.
Another aspect of the immigrant experience, according to a Pew Research Center survey, is that people are less likely to identify themselves as Hispanic the more generations they are from their immigrant roots. Among U.S.-born children with Hispanic ancestry and at least one immigrant parent, 92% identify as Hispanic. But among the next generation, that falls to 77%.

