
One question we’re often asked is, Why aren’t Asian Americans shown as a separate group when differences among whites, blacks and Hispanics are discussed?
It’s worth noting that Asians are indeed included in our U.S. surveys. While we often do not break out their standalone views, Asians’ responses are still incorporated into the general population figures that we report.
Nonetheless, it’s a good question, and one we hear frequently, so we put together a summary of some of the methodological and other issues on accurately polling U.S. Asians.
The demographic challenge of polling Asian Americans
The most obvious hurdle is the relatively small number of Asians in the U.S. compared with other races and ethnicities. According to 2014 Census Bureau estimates, 5.4% of U.S. adults are Asian, compared with 11.7% who are black, 15.2% who are Hispanic and 65.1% who are white.
What does that mean when it comes to who is represented in a poll?
A typical survey of the U.S. population consists of 1,000 adult respondents. This threshold reflects the way in which many researchers attempt to balance survey cost with survey quality: A national sample of 1,000 interviews yields reasonably good precision for major subgroups defined by gender, age, race and ethnicity; much larger sample sizes will reduce the margin of error minimally but also make polls much more expensive. (Pew Research Center samples are typically 1,500 respondents or more.)
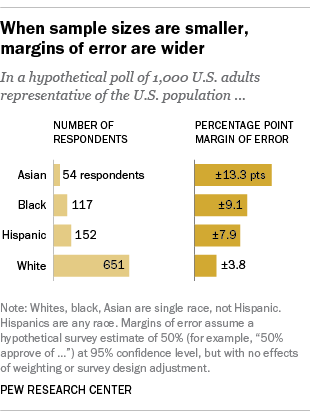
A common rule of thumb used at Pew Research Center and elsewhere is to only report subgroup estimates if they are based on at least 100 respondents. In a perfectly representative survey with 1,000 adults, we would expect about 152 Hispanics, 117 blacks and just 54 Asians – with the latter subgroup falling well under the 100-respondent limit. The size of this Asian subgroup would simply be too small to make reliable estimates of the views and experiences of Asian American adults as a whole.
For example, if we were to find that “50% of U.S. Asians approve of …,” the margin of error for the Asian subgroup of 54 respondents would be 13.3 percentage points – meaning that somewhere between 37% and 63% of Asians in the country would “approve of” the hypothetical topic. That range, or “confidence interval,” would simply be too large to report.
While increasing the sample size would help, it’s not enough to address another issue …
Reaching Asian Americans from a wide range of backgrounds
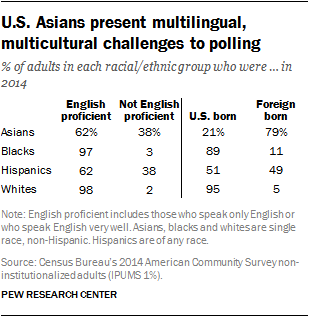
U.S. Asians are more likely than whites and blacks, but not Hispanics, to lack proficiency in English. Just 62% of U.S. Asian adults speak English proficiently, while 38% speak English less than very well. By comparison, 38% of Hispanics, 3% of blacks and 2% of whites speak English less than very well, according to self-reported data among non-institutionalized adults in the 2014 American Community Survey.
Because of Asians’ linguistic diversity, pollsters may need to translate their questionnaires into several other languages (such as Mandarin, Cantonese, Tagalog, Japanese and Vietnamese, among others) to obtain a sample representative of all Asians in the U.S. (By contrast, it would suffice to poll Hispanics using only English and Spanish, and blacks and whites in just English.) While it’s difficult enough to translate questions from one language to another, it’s even more difficult to do this across multiple languages, especially when trying to ask balanced questions about sensitive issues. There are some groups with lower English proficiency rates – such as Vietnamese and Chinese Americans – where this issue is particularly important.
Additionally, with a majority of Asian Americans being first-generation immigrants, there are some unique multicultural challenges for participation in surveys. More than three-quarters (79%) of U.S. Asian adults are foreign born, compared with 49% of Hispanics, 11% of blacks and just 5% of whites. This is important because some questions might be more sensitive to certain cultural groups, or they may mean different things in different contexts. And certain cultural groups might be more likely to refuse participating in surveys altogether.
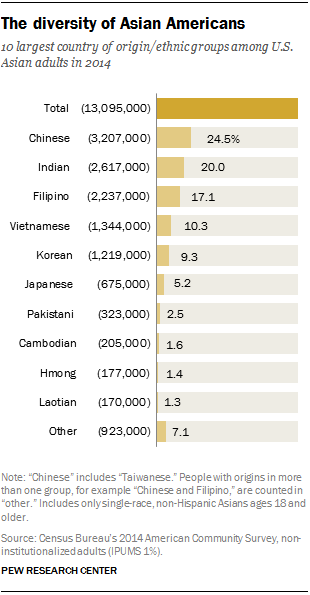
Other challenges arise in presenting results that include views and behaviors of Asian Americans as a whole because the group is so diverse. Not only do they speak dozens of different languages, they also hail from many different cultural and ethnic backgrounds and are only bound together because they claim racial/ethnic roots from the vast continent of Asia. (A similar argument could be made for Hispanics, though they at least partly share a common language: Spanish.)
While subgroups under the “Asian American” umbrella may hold vastly different views from each other, the views of Asian Americans when reported as a whole naturally represent views of some groups – the more populous ones – more than others. For example, the views of Chinese, Indian and Filipino Americans are more heavily represented than those of Pakistani or Laotian Americans, because the former groups make up a much larger share of the U.S. Asian population.
How pollsters currently survey Asian Americans
In order to accurately portray Asian Americans’ views in surveys, pollsters first have to obtain a large and representative sample of Asian Americans. Then they need to translate the questionnaire into enough languages so respondents are able to share their opinions clearly.
Pollsters can do this by fielding a sample of all U.S. adults in which Asians are oversampled – which means they are polled at a disproportionately higher rate than normal; such an oversample makes it possible to compare views among Asians with other groups, such as blacks, Hispanics and whites, while also including Asians in the national U.S. sample through proper statistical weighting. Pollsters can also do this by designing a study in which only Asians are interviewed, as we did in our 2012 reports, “The Rise of Asian Americans,” and “Asian Americans: A Mosaic of Faiths.” (In this case, we used multiple sampling frames, for example by combining random-digit dial, including geographic targeting, with lists and recontacts of previously identified Asian households.)
The 2012 Asian American survey gathered a nationally representative sample of 3,511 Asians ages 18 and older living in the U.S. The sample included 728 Chinese, 580 Indian, 515 Japanese, and 504 each for Filipino, Korean and Vietnamese, as well as 176 respondents from other U.S. Asian groups; their demographic composition was then adjusted to be proportional to the overall Asian population at the time. Interviews were conducted in English, as well as Mandarin, Cantonese, Hindi, Japanese, Korean, Tagalog and Vietnamese (1,173 of the 3,511 interviewed did so in a language other than English).
Another more limited method of polling U.S. Asians is to take a rolling average across multiple surveys that ask the same question – allowing the sample size of Asians to increase and the margin of error to decrease. Pew Research Center’s Feb. 18 article, for example, on Asian Americans’ technology use was based on a rolling average across four surveys conducted in 2015. However, those results were limited to English-speaking Asians, since we only offered the survey in English and Spanish.
The future of polling Asian Americans
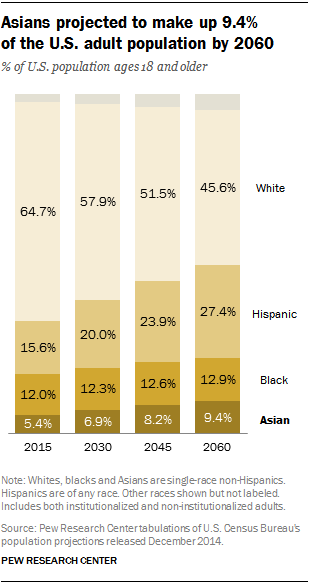
The challenges of polling Asian Americans are likely to persist in the foreseeable future, though some trends may make this task easier. Among U.S. adults, Asians are projected to be the third-fastest-growing racial/ethnic group behind Hispanics and multiracial adults. By 2030, Asians will make up 6.9% of U.S. adults, and by 2060, they will make up 9.4% of the adult population.
One challenge for future Asian American polling is related to the increased use of nonprobability polls – a survey method that is fast and relatively inexpensive, at a time when traditional telephone polling faces historically low response rates and high expenses. These polls tend to return higher errors for racial/ethnic minority groups than probability samples. For an explanation of nonprobability polls, see our Fact Tank post, “What we learned about online nonprobability polls.”