
This week marks a new experimental milestone for Pew Research Center: We’ve released our first report using survey findings collected with mobile software applications, or “apps.”
The rise of apps in an increasingly mobile world is a major social, political and economic story that we have been documenting for years. As researchers, we’ve felt for some time that apps hold a lot of promise for data collection. Not only could apps-based surveys potentially make surveys more “mobile friendly,” but they might also allow people to provide different kinds of information that is sometimes difficult to gather in traditional phone surveys, such as location data or exactly when people use certain smartphone features.
Yet little work has been done by social science researchers examining whether apps are a viable survey tool. And we were unable to find any research comparing app-based surveys with polls administered through Web browsers. We used an app that enabled people to take our surveys on their smartphone or tablet, even when the phone is not connected to the internet. We also allowed people to take the survey using any Web browser, including a smartphone, tablet, laptop or desktop, but that required an internet connection. Our new, experimental work compared the results of these two modes, and what we found is fascinating.
Here’s what we did:
We wanted to learn more about how Americans use their smartphones during various times of the day, and we wanted real-time answers.
To achieve this, we decided to survey members of our American Trends Panel – a group of randomly selected U.S. adults who have agreed to participate in our regular surveys – about smartphone usage. All of them gave their consent to take the surveys and for us to collect data using these experimental methods.
We randomly assigned 1,635 panelists to complete the surveys via either a smartphone app or Web browser. Next, we gave them a series of surveys – 14 in all – about their smartphone use. Those taking the survey were prompted over the course of seven days via emails, text messages, and app alerts that we sent them. We did this in order to capture “in the moment” responses about smartphone use. We asked: 1) What features of their smartphone had they used in the past hour? 2) Where were they when they used their smartphone? 3) What did they accomplish with the smartphone? 4) How did they feel about what they had done?
What we learned:
1) Immediate responses and feedback can be helpful and revealing. Traditional surveys can capture some elements of behavior by asking people about what activities they have done in the past. For many years, Pew Research has regularly asked phone survey respondents what they did “yesterday” (for example, “Did you use your smartphone yesterday?” or “Did you read a newspaper yesterday?”). Pew Research has also asked respondents how often they engage in certain behaviors, using a scale from “frequently” to “never.” Those results are illuminating in providing us with insights into media consumption and technology use. But in our mobile experiment, we could make those insights more specific, asking people what they had done in the past hour.
For instance, 31% of smartphone owners in a traditional retrospective survey reported using their smartphone frequently for help with directions, such as turn-by-turn navigation. However, results from the “in the moment” surveys show that 41% of respondents reported using “maps or traffic” at least once over the weeklong field period. While these weren’t the exact same questions or response options used on each survey, they were similar enough to highlight the fact that asking in real time can lead to different results than when respondents are asked to give a response retrospectively.
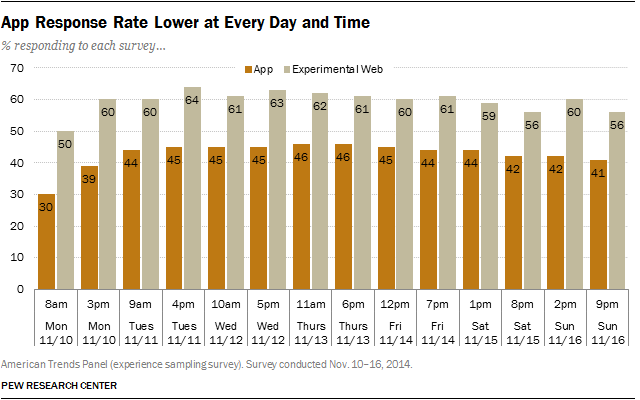
2) App response rates were lower than Web rates overall and for each of the 14 surveys we conducted. When conducting a new poll, survey researchers often go to a lot of trouble to find out how many of the people they targeted to take the survey actually end up completing the questionnaire, a concept referred to as the response rate. In this case, we found that those who were asked to take the survey on a Web browser were more likely to complete at least one survey than those using apps to take the survey, resulting in overall response rates of 84% and 58%, respectively. Part of this may be due to the fact that many panelists assigned to use the app had trouble using it because they didn’t know what an app was, how to download it or how to use it even though they own a smartphone. In the future, we will take this into consideration because if fewer people use the survey app, this has implications for both the precision of the data collected and for cost.
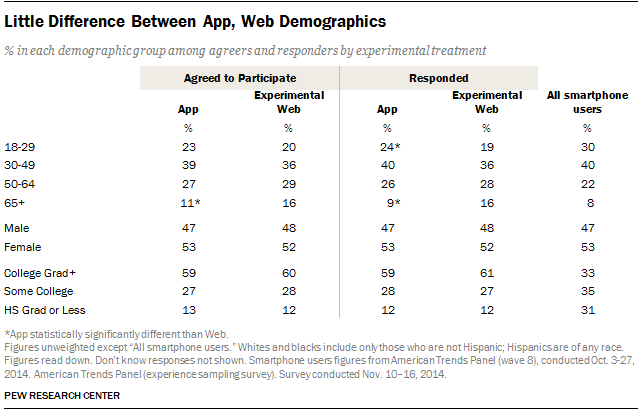
3) App and Web respondents look similar demographically, and their answers basically did not differ. App respondents were somewhat younger, more likely to be from the Midwest and less likely to be registered to vote than Web respondents. Overall, app respondents looked slightly more like all smartphone users than did the Web respondents. In the final reckoning, though, both the app and Web respondents look similar enough in terms of demographics that either could be used to represent all smartphone users.
Out of the 34 substantive survey items measured, the groups differed on only one: App respondents were less likely to have taken pictures or videos with their smartphone. This means that either approach is equally valid to produce findings about smartphone use.
4) There are some advantages to using apps for “experience sampling” of this kind. Even though we didn’t do it in our research, apps can be programmed to passively collect non-survey data from smartphones, including information about what other apps are being used by respondents and information about respondents’ location, which can be gathered via the phone’s GPS system. Of course, researchers collecting that kind of data would have to get additional consent from respondents to have this kind of data capture take place. One thing we did learn is that apps can work offline by notifying respondents about a survey and allowing them to complete it when they aren’t connected to the internet, which provides an added convenience to the survey-taker.
5) Using apps in survey research also has its disadvantages: It can be costly and be limited in terms of design and devices. First, some survey apps vendors price their services on a per-survey basis, which is not ideal for the type of repeated data collection to which an app lends itself. Second, apps can have more design constraints than Web surveys. For instance, in our survey, the design limited our ability to provide randomized-response options and provided limited options in terms of navigation buttons and check boxes. These constraints can introduce measurement error. Third, apps are mobile-focused. They have to be installed on either a smartphone or tablet, whereas Web surveys can be taken on a smartphone, tablet, laptop or desktop.
A technical paper on this new methodology was released earlier this week and will be presented to public opinion experts at the annual conference of the American Association for Public Opinion Research next month.