
Cuban immigration waves, 1950 to 2024
Legal permanent resident (LPR) admissions and other arrivals from Cuba, by fiscal year
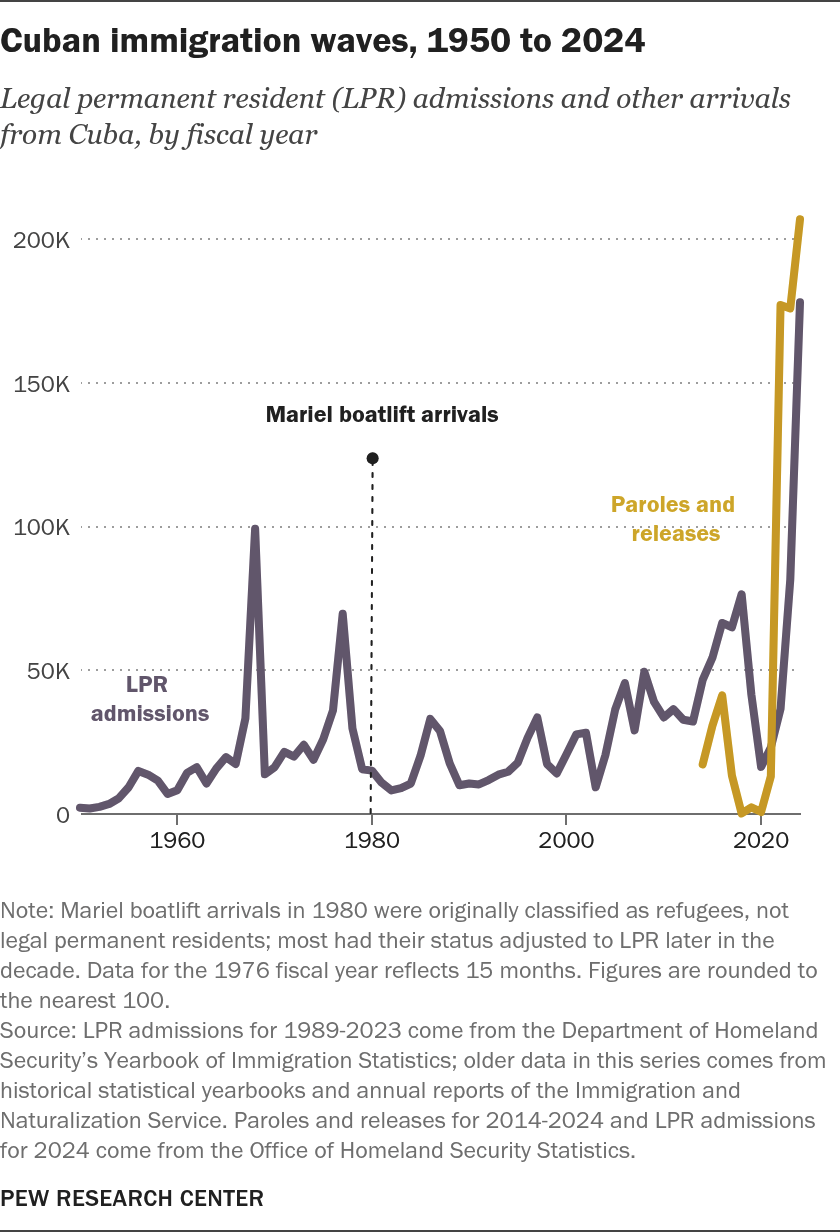
Note: Mariel boatlift arrivals in 1980 were originally classified as refugees, not legal permanent residents; most had their status adjusted to LPR later in the decade. Data for the 1976 fiscal year reflects 15 months. Figures are rounded to the nearest 100.
Source: LPR admissions for 1989-2023 come from the Department of Homeland Security’s Yearbook of Immigration Statistics; older data in this series comes from historical statistical yearbooks and annual reports of the Immigration and Naturalization Service. Paroles and releases for 2014-2024 and LPR admissions for 2024 come from the Office of Homeland Security Statistics.
PEW RESEARCH CENTER
Cuban immigration waves, 1950 to 2024
Legal permanent resident (LPR) admissions and other arrivals from Cuba, by fiscal year
| Year | LPR admissions | Paroles and releases | Mariel boatlift arrivals |
|---|---|---|---|
| 1950 | 2,200 | ||
| 1951 | 1,900 | ||
| 1952 | 2,500 | ||
| 1953 | 3,500 | ||
| 1954 | 5,500 | ||
| 1955 | 9,300 | ||
| 1956 | 15,000 | ||
| 1957 | 13,700 | ||
| 1958 | 11,600 | ||
| 1959 | 7,000 | ||
| 1960 | 8,300 | ||
| 1961 | 14,300 | ||
| 1962 | 16,300 | ||
| 1963 | 10,600 | ||
| 1964 | 15,800 | ||
| 1965 | 19,800 | ||
| 1966 | 17,400 | ||
| 1967 | 33,300 | ||
| 1968 | 99,300 | ||
| 1969 | 13,800 | ||
| 1970 | 16,300 | ||
| 1971 | 21,600 | ||
| 1972 | 20,000 | ||
| 1973 | 24,100 | ||
| 1974 | 18,900 | ||
| 1975 | 26,000 | ||
| 1976 | 36,000 | ||
| 1977 | 69,700 | ||
| 1978 | 29,800 | ||
| 1979 | 15,600 | ||
| 1980 | 15,100 | 125,000 | |
| 1981 | 10,900 | ||
| 1982 | 8,200 | ||
| 1983 | 9,000 | ||
| 1984 | 10,600 | ||
| 1985 | 20,300 | ||
| 1986 | 33,100 | ||
| 1987 | 28,900 | ||
| 1988 | 17,600 | ||
| 1989 | 10,000 | ||
| 1990 | 10,600 | ||
| 1991 | 10,300 | ||
| 1992 | 11,800 | ||
| 1993 | 13,700 | ||
| 1994 | 14,700 | ||
| 1995 | 17,900 | ||
| 1996 | 26,500 | ||
| 1997 | 33,600 | ||
| 1998 | 17,400 | ||
| 1999 | 14,100 | ||
| 2000 | 20,800 | ||
| 2001 | 27,700 | ||
| 2002 | 28,300 | ||
| 2003 | 9,300 | ||
| 2004 | 20,500 | ||
| 2005 | 36,300 | ||
| 2006 | 45,600 | ||
| 2007 | 29,100 | ||
| 2008 | 49,500 | ||
| 2009 | 39,000 | ||
| 2010 | 33,600 | ||
| 2011 | 36,500 | ||
| 2012 | 32,800 | ||
| 2013 | 32,200 | ||
| 2014 | 46,700 | 17,300 | |
| 2015 | 54,400 | 30,700 | |
| 2016 | 66,500 | 41,300 | |
| 2017 | 65,000 | 13,400 | |
| 2018 | 76,500 | 200 | |
| 2019 | 41,600 | 2,300 | |
| 2020 | 16,400 | 700 | |
| 2021 | 23,100 | 13,100 | |
| 2022 | 36,600 | 177,200 | |
| 2023 | 81,600 | 176,000 | |
| 2024 | 178,100 | 207,000 |
Note: Mariel boatlift arrivals in 1980 were originally classified as refugees, not legal permanent residents; most had their status adjusted to LPR later in the decade. Data for the 1976 fiscal year reflects 15 months. Figures are rounded to the nearest 100.
Source: LPR admissions for 1989-2023 come from the Department of Homeland Security’s Yearbook of Immigration Statistics; older data in this series comes from historical statistical yearbooks and annual reports of the Immigration and Naturalization Service. Paroles and releases for 2014-2024 and LPR admissions for 2024 come from the Office of Homeland Security Statistics.
PEW RESEARCH CENTER

