
After the cost of solar panels plummeted, solar power has grown sharply as a global electricity source
Average price of a solar panel vs. global electricity generated from solar
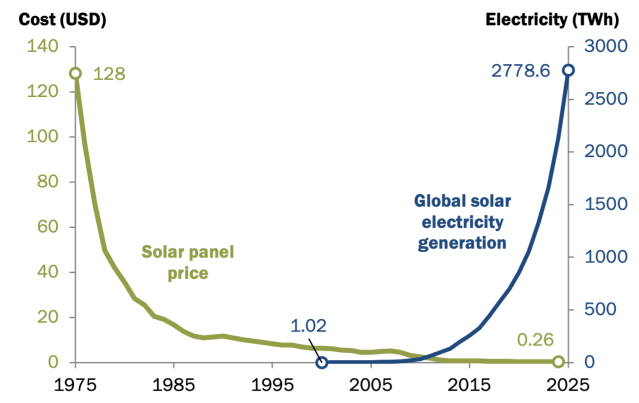
Note: Costs are expressed in constant 2024 U.S. dollars per watt.
Source: IRENA (2025), Nemet (2009), and Farmer and Lafond (2016) via Our World in Data, “Solar photovoltaic module price”; Ember, “Yearly Electricity Data” (accessed June 23, 2026).
PEW RESEARCH CENTER
After the cost of solar panels plummeted, solar power has grown sharply as a global electricity source
Average price of a solar panel vs. global electricity generated from solar
| Year | Solar panel price | Global solar electricity generation |
|---|---|---|
| 1975 | 128.27 | |
| 1976 | 96.51 | |
| 1977 | 70.41 | |
| 1978 | 49.81 | |
| 1979 | 41.86 | |
| 1980 | 35.47 | |
| 1981 | 28.36 | |
| 1982 | 25.48 | |
| 1983 | 20.57 | |
| 1984 | 19.11 | |
| 1985 | 16.69 | |
| 1986 | 13.80 | |
| 1987 | 11.73 | |
| 1988 | 10.96 | |
| 1989 | 11.33 | |
| 1990 | 11.72 | |
| 1991 | 10.85 | |
| 1992 | 10.11 | |
| 1993 | 9.46 | |
| 1994 | 8.95 | |
| 1995 | 8.27 | |
| 1996 | 7.73 | |
| 1997 | 7.71 | |
| 1998 | 6.94 | |
| 1999 | 6.41 | |
| 2000 | 6.29 | 1.02 |
| 2001 | 6.09 | 1.36 |
| 2002 | 5.57 | 1.72 |
| 2003 | 5.29 | 2.11 |
| 2004 | 4.56 | 2.78 |
| 2005 | 4.60 | 3.95 |
| 2006 | 5.02 | 5.42 |
| 2007 | 5.06 | 7.29 |
| 2008 | 4.61 | 11.85 |
| 2009 | 3.08 | 19.82 |
| 2010 | 2.44 | 32.21 |
| 2011 | 2.00 | 63.56 |
| 2012 | 1.08 | 96.92 |
| 2013 | 0.83 | 131.75 |
| 2014 | 0.77 | 197.74 |
| 2015 | 0.72 | 256.01 |
| 2016 | 0.66 | 327.47 |
| 2017 | 0.56 | 444.65 |
| 2018 | 0.50 | 575.16 |
| 2019 | 0.45 | 697.94 |
| 2020 | 0.36 | 853.39 |
| 2021 | 0.32 | 1053.99 |
| 2022 | 0.36 | 1333.12 |
| 2023 | 0.31 | 1664.16 |
| 2024 | 0.26 | 2142.91 |
| 2025 | 2778.6 |
Note: Costs are expressed in constant 2024 U.S. dollars per watt.
Source: IRENA (2025), Nemet (2009), and Farmer and Lafond (2016) via Our World in Data, “Solar photovoltaic module price”; Ember, “Yearly Electricity Data” (accessed June 23, 2026).
PEW RESEARCH CENTER

