In this data essay, we analyzed the national and state-level shifts in racial and ethnic makeup of the United States electorate from 2000 to 2018. The term “eligible voters” refer to persons ages 18 and older who are U.S. citizens. All references to Asian, Black and White adults are single-race and refer to the non-Hispanic components of those populations. Hispanics are of any race.
This data essay’s analysis is based on Pew Research Center tabulations derived from the following U.S. Census Bureau data: the American Community Survey (2018 and 2010), the 2000 U.S. decennial census, and the November Voting and Registration Supplement of the Current Population Survey (2000, 2004, 2008, 2012 and 2016).
Detailed demographic and geographic data
Analysis of the racial and ethnic makeup and trends of eligible voters are from the American Community Survey(ACS), the largest household survey in the United States, with a sample of more than 3 million addresses. It covers the topics previously covered in the long form of the decennial census. The ACS is designed to provide estimates of the size and characteristics of the nation’s resident population, which includes persons living in households and group quarters. For more details about the ACS, including its sampling strategy and associated error, see the yearly American Community Survey’s Accuracy Statement provided by the U.S. Census Bureau.
The specific data sources used in this data essay are the 1% samples of the 2018 and 2010 ACS and the 5% sample of the 2000 decennial census, all provided through Integrated Public Use Microdata Series (IPUMS) from the University of Minnesota. IPUMS assigns uniform codes, to the extent possible, to data collected by the decennial census and the ACS from 1850 to 2018. For more information about IPUMS, including variable definition and sampling error, please visit the “IPUMS Documentation and User Guide.”
Voter turnout rates
The data essay’s analysis of voter turnout rates in presidential elections is based on the November Voting and Registration Supplement of the Current Population Survey (CPS), a monthly survey of approximately 55,000 households that is the only nationally representative source of data on the proportion of the population and subpopulations that reported registering to vote and voting. The universe for the CPS is the non-institutionalized civilian population. For more details about the CPS, including the sampling strategy and associated error, download the series of Technical Documentations provided by the U.S. Census Bureau.
The specific data sources for this data essay are the 2000, 2004, 2008, 2012 and 2016 November Voting and Registration Supplements to the monthly CPS, downloaded from the National Bureau of Economic Research’s website.
Categorization of battleground states
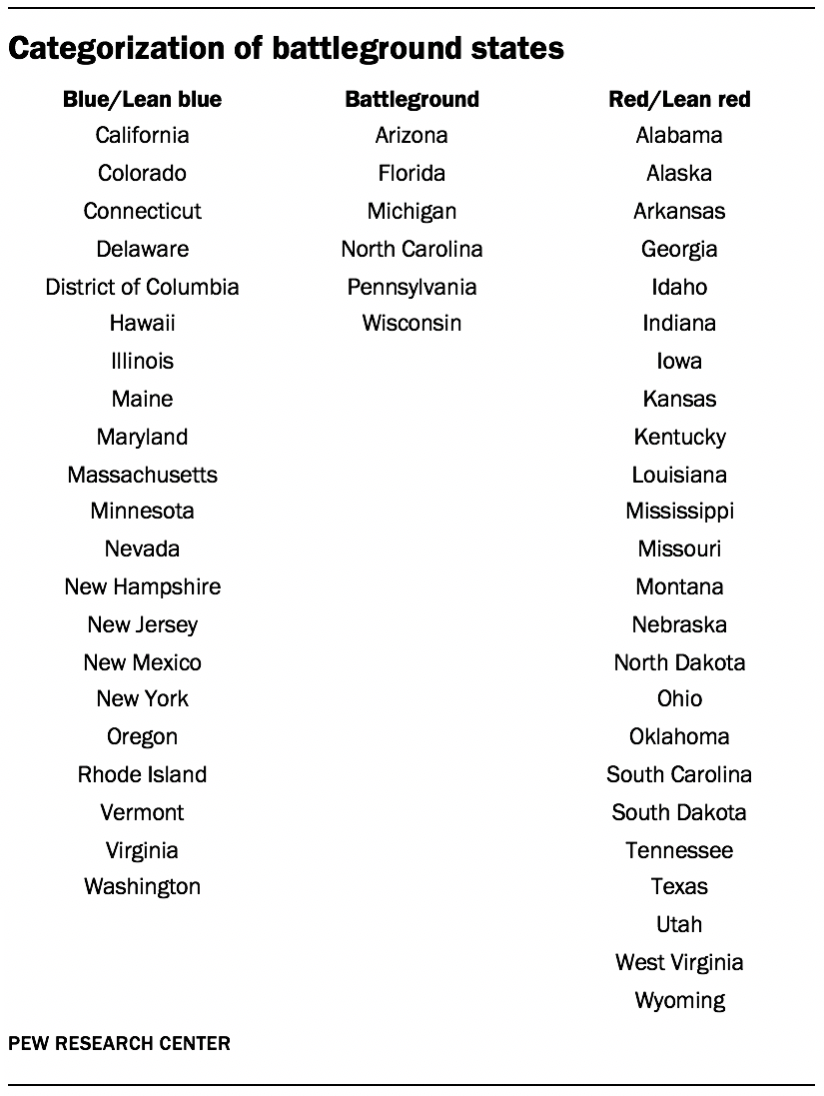
To identify battleground states for the November presidential election, researchers consulted several experts’ forecasts (including Larry Sabato’s Crystal Ball, the Cook Political Report, Inside Elections and Nate Cohn’s New York Times ratings) to come up with a categorization of each state as either likely to back the Democrat (Blue/lean blue), likely to back the Republican (Red/lean Red), or a “battleground state.” The specific states in each category can be found in the accompanying table.
Party Identification by race and ethnicity
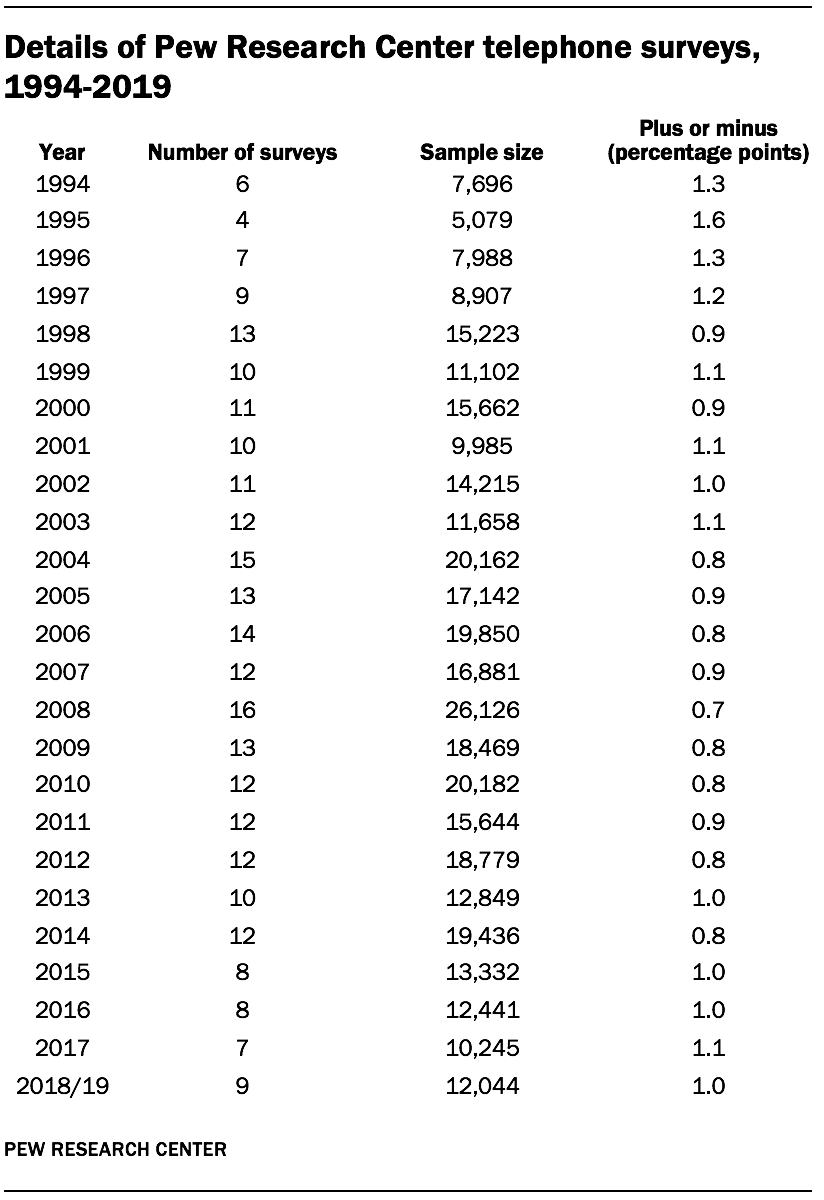
The analysis of changes in party identification over time is based on a compilation of 266 telephone surveys and more than 360,000 interviews among registered voters conducted by Pew Research Center from January 1994 to September 2019. These surveys are combined into one large data file that can be sorted according to a range of demographic characteristics, with comparisons made across different time periods. Yearly totals are calculated by combining all surveys for the calendar year, with appropriate weights applied. Because fewer telephone polls were conducted in 2018 and 2019, data for those years has been combined. The corresponding table shows the number of surveys and interviews conducted each year as well as the margin of error for each yearly sample.
Party Identification among Hispanic origin groups
Mentions of the differences in party identification among Cubans, Mexican and Puerto Rican eligible voters in the U.S. are taken from the Pew Research Center’s 2019 National Survey of Latinos, a survey of 3,030 U.S. Hispanic adults conducted in December 2019. The sample includes 2,094 Hispanic adults who were members of Pew Research Center’s American Trends Panel (ATP), an online survey panel that is recruited through national, random sampling of residential addresses. It also includes an oversample of 936 respondents sampled from Ipsos’ KnowledgePanel, another online survey panel also recruited through national, random sampling of residential addresses. See the survey’s full methodology here.

