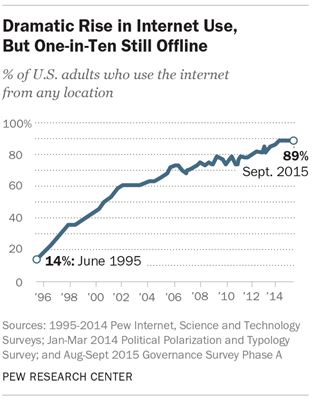
Drawn both by lower data collection costs and substantial advantages in how questionnaires can be designed and administered, survey research is rapidly moving to the Web. Adoption of the Web for data collection is occurring in all sectors of the industry from the U.S. Census Bureau, which now allows respondents to take the American Community Survey on the Web, to political polling, where the cost and difficulty of targeting phone calls geographically is prompting more organizations to rely on online polls, to the marketing research community, which has moved virtually all consumer surveys to the Web. One key factor that has made this shift possible is the fact that the vast majority of Americans now use the internet. Pew Research Center telephone surveys have documented the rise in internet adoption, which has grown from 14% of the U.S. adult population in 1996 to 89% today.
But 89% is not 100%, and surveys that include only those who use the internet (and are willing to take surveys online) run the risk of producing biased results. How large is that risk? This analysis documents how a wide range of common survey findings would differ if those who are unable or unwilling to take surveys online are excluded. It relies upon a series of surveys conducted over the past 15 months by Pew Research Center with its nationally representative American Trends Panel. Most members of the panel participate via the Web, while those who are unable or unwilling to take surveys online are typically interviewed by mail. By comparing the results for the full sample with those produced by the Web sample, it is possible to assess the consequences of excluding the non-internet population from surveys.
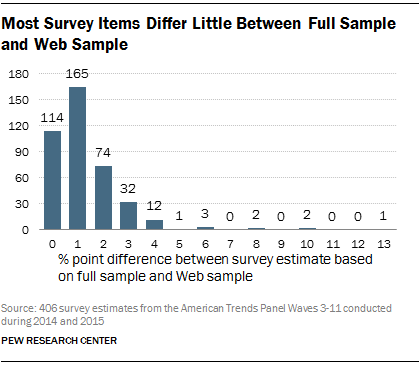
This comparison of hundreds of individual survey questions, with and without the offline population, found that for most of the topics studied by Pew Research Center, the size of the bias caused by excluding the non-Web respondents is quite small. Across 406 separate survey items, only nine yielded estimates that differed by 5 or more percentage points. More than two-thirds of the 406 items yielded estimates with a 0 or 1 point difference. This is a consequence of the fact that the non-Web survey group is a small share of the total population, as well as the fact that the size of the differences between the Web and non-Web groups tends to be relatively modest on most questions.
But for a few topics, the differences are larger. Items related to the use of the internet and technology show substantial bias in Web-only samples. Smaller, but still significant, biases appear on items as diverse as political knowledge and financial circumstance. And equally important, even for questions where the overall differences are modest, there may be a sizeable bias among certain subgroups in the population, such as those 65 and older, where online and offline individuals are very different.
Data in this report are drawn from the third through 11th waves of data collection of Pew Research Center’s American Trends Panel (ATP). The ATP is a nationally representative, probability-based panel of U.S. adults living in households. Respondents who self-identify as internet users and who provided an email address participate in the panel via monthly self-administered Web surveys, while those who do not use the internet, do not have an email address or refuse to provide their email address participate via the mail. Additional information including field dates, sample sizes and margins of error can be found in the methods section of this report.
Survey items were chosen for inclusion if they were asked of the total sample and not only the Web-mode panelists. Items were excluded if they had complex skip patterns based on previous waves’ responses. A few items were excluded if they, or an item very similar to them, were already asked in a previous wave. The items chosen for the analysis of differences among subgroups in the population are frequently used measures across the major research domains at Pew Research Center.
For this analysis two weights were created for each wave of data collection. The first weights the total sample, including the Web and mail panelists, to demographic targets of all U.S. adults living in households. The second weights only the Web-mode portion of the panel to these same total population targets. Additional information about the weighting, including the sources of the targets, can be found in the methods section at the end of this report.
All differences of 3 percentage points or larger are statistically significant as are most of those with a 2-point difference. Even some differences of 1 point passed a significance test. These statistical tests account for both the design effect from the weights and the fact that the Web respondents are a subsample of the total respondents. This overlap means that very small differences are statistically significant, much smaller than if the Web and total respondents were two independent samples. For this reason, the major focus in this report is on differences that are large enough to be substantively meaningful.
Web and Mail Samples Very Different
As the non-internet population shrinks, its demographic profile grows steadily different from the rest of the population. Moreover, those individuals who report making at least occasional use of the internet but who say they cannot or will not take surveys online are more similar demographically to those who are not online than they are to other internet users. Such differences between people who are covered by Web surveys and those who are not can potentially pose a risk to the accuracy of survey estimates based solely on respondents able and willing to take Web surveys.
According to Pew Research Center estimates, 89% of U.S. adults self-identify as internet users. The fact that a Web-only survey would be excluding roughly one-in-ten adults might be considered unimportant, but the true share of the population that will be excluded from a Web-only survey is actually larger than that estimate suggests. In addition to respondents who are not internet users, some respondents invited to participate in a Web panel either do not have or will not be willing to provide an email address in order to facilitate participation online.
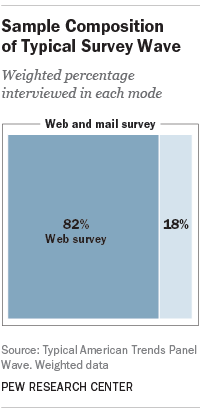
In fact, a little less than half of the typical mail sample of the American Trends Panel consists of internet users who, for one reason or another, declined to participate in the panel via the Web.1 And that share likely would have been higher if we had not stopped inviting these respondents to join the panel partway through recruitment. (For a detailed description of panel recruitment, see the methods section of this report.) In total, the weighted share of panelists who take surveys by mail is around 18%.
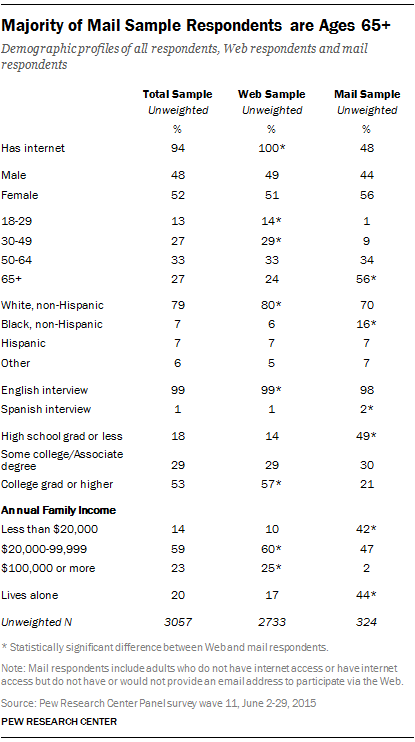
The nearly two-in-ten adults who would be excluded from a Web-only sample – either by necessity or by choice – are very different from adults who are willing to participate in a Web panel. These differences extend across almost all major demographic, economic and political characteristics. Differences between these two samples track closely with the shares of each subgroup that are internet users.
For example, more than half of the mail sample (56%) are adults ages 65 and older and just 1% are adults younger than 30. By comparison, 24% of Web respondents are 65 and older and 14% are younger than 30. This is a reflection of the fact that just 66% of adults ages 65 and older say they are internet users, compared with 99% of adults younger than 30.2
Compared with the Web sample, the mail sample also has a much larger proportion of blacks (16% vs. 6%) and a smaller proportion of whites (70% vs. 80%). Some 7% of adults in each sample are Hispanic.
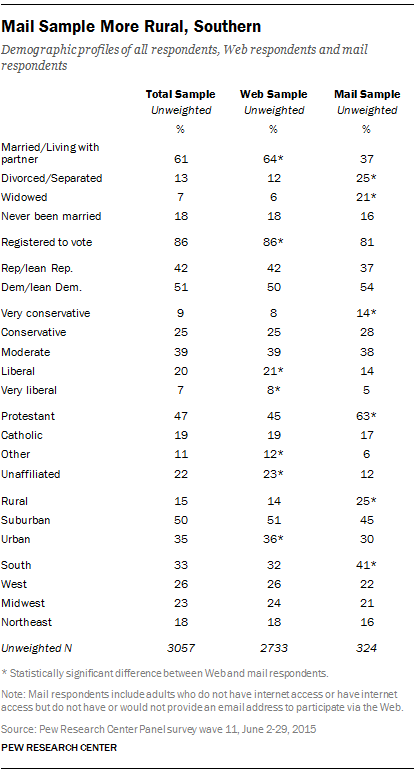
In part because of their age profile, mail respondents are less likely to be married or living with a partner and more likely to live alone than Web respondents. About two-thirds (64%) of the Web sample are married or partnered, compared with 37% of the mail sample. And some 44% of mail respondents live alone, compared with just 17% of Web respondents.
About half of mail respondents (49%) have a high school diploma or less education and only 21% have completed college. By comparison, 57% of the Web sample have graduated from college, while just 14% have a high school diploma or less.
Mail respondents are also much less affluent than Web respondents. Some 42% of mail respondents have family incomes less than $20,000, compared with 10% of Web respondents. And fully one quarter (25%) of Web respondents have incomes of $100,000 annually or higher, compared with just 2% of mail respondents.
There are smaller differences between Web and mail respondents in terms of political identity and engagement: 42% of the Web sample is Republican or Republican-leaning, compared with 37% of the mail sample. Mail respondents are more likely than Web respondents to describe their political views as conservative (42% vs. 33%), whereas respondents in the Web sample are more likely to describe their views as liberal (29% vs. 19%). Web respondents are a little more likely than mail respondents to say they are absolutely certain that they are registered to vote (86% vs. 81%).
The religious profile of mail respondents differs from that of Web respondents. About two-thirds (63%) of mail respondents are Protestant, compared with 45% of Web respondents. And mail respondents are about half as likely as Web respondents to describe themselves as atheist, agnostic or having no religion in particular (12% vs. 23%). Furthermore, mail respondents are more likely than Web respondents to say they attend religious services at least weekly (46% vs. 34%).
Finally, in terms of geographic location, the mail sample has a higher share living in rural areas (25% vs. 14%) and a lower share living in urban areas (30% vs. 36%) than the Web sample. And while regional dispersion is similar across the Northeast, Midwest and West, the South is represented more heavily among mail respondents than among Web respondents (41% vs. 32%).
Modest Differences Between Total Samples and Web-Only Samples
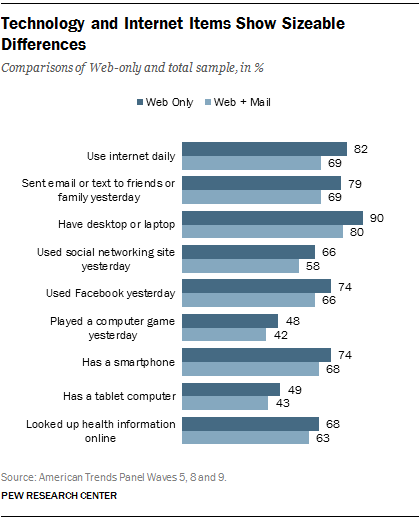
Despite the sizeable differences between the Web and mail samples, most survey estimates produced by Web surveys will be a little different from those produced by surveys that cover the entire public. Of 406 separate estimates taken from nine waves of the American Trends Panel, just nine of them differed by 5 percentage points or more. Perhaps not surprisingly, all nine are related to internet or digital technology use. A Web-only survey estimated that 82% of the public uses the internet on a daily basis, while the full sample (including non-internet users) finds 69% go online daily. Similarly, there is a 10-point difference in the percentage of people who report having sent an email or text message to a friend or relative yesterday (79% among the Web sample vs. 69% among the full sample). There is also a 10-point difference in reported ownership of a laptop or desktop computer (90% of the Web sample vs. 80% overall).
Twelve of the 406 items examined yielded a 4-point difference between the Web and total samples. Four of the 12 were related to internet or technology use, while three were questions from a news and political knowledge quiz (the Web sample was more knowledgeable than the total sample) and three of the items pertained to financial or travel resources, including having a passport, a credit card, IRA, 401K or similar kind of retirement account (with the Web sample more likely than the total sample to have each of these).
There were 32 items with a difference of 3 percentage points. These covered a variety of topics, including other financial assets and instruments (savings account, checking account, pension plan), political and science knowledge items, health problems and disabling conditions (with higher incidence of the latter in the total sample than the Web sample). The remaining 353 items yielded differences of 2 points (74 items), 1 point (165) or 0 points (114). The complete list of items and estimates from the total and Web samples can be found in the appendix.
Larger Differences for Certain Subgroups
Subgroups of the population with lower rates of internet adoption are vulnerable to larger biases in Web-only surveys. This not only threatens point estimates made for these groups but also affects the validity of inferences made about the relationship between certain demographic or social characteristics and various outcomes of interest.
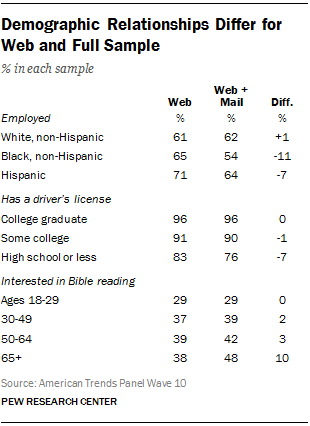
Among adults 65 and older, the estimate of daily internet use is 35 points higher in a Web survey than the full sample (74% vs. 39%). Other questions related to internet use, such as social networking, are similarly affected. But even items about non-tech topics show sizeable biases among this age group. Web survey respondents ages 65 and older are 10 points more likely to say they feel very safe walking after dark in their neighborhoods than do those interviewed in the combined Web and mail samples. Interest in reading the Bible is 10 points higher among the full sample than among the Web sample alone. Such differences are nonexistent among adults ages 18 to 29, which makes the relationship of this question with age appear weaker in the Web-only sample than in the full sample.
Education also appears to have a much stronger relationship with having a driver’s license in the full sample than it does in the Web-only sample. In both samples, 96% of college graduates report having a license, but there is a 7-point gap between the Web and total samples among those with a high school diploma or less.
Similarly, the relationship between race and employment status is quite different in the Web-only sample than the full sample. Blacks (65%) have a similar rate of employment as whites (61%) in the Web sample, but among the full sample the white employment rate is 8 points higher than among blacks (62% vs. 54%).
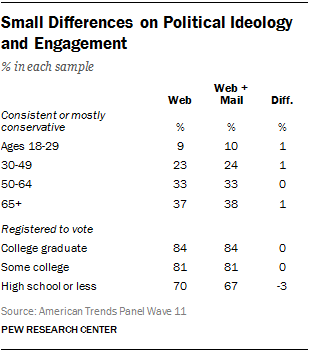
One area of generally positive news for Web surveys is that estimates of political preferences and engagement are relatively unaffected by internet coverage bias, even among subgroups of the population with relatively lower levels of internet use. On a 10-item index of ideological consistency, there was almost no difference between the Web and total samples across age groups. Similarly, the pattern of reported voter registration by educational attainment was very similar in the online and total samples.
Conclusion
It is hardly an exaggeration to say that the Web is transforming survey research. Widespread internet adoption coupled with the speed, low cost and efficiency of data collection online is leading most survey organizations to shift at least some data collection to the Web or to consider doing so.
Self-administered surveys on the Web have many advantages in terms of measurement quality but as a previous Pew Research Center study on the impact of survey mode noted, there are still issues to be dealt with. The current study finds that the coverage bias associated with Web surveys is modest for most kinds of measures, but it is not absent entirely. About one-in-ten Americans does not use the internet, and many others may have access but decline to take surveys on the Web. As a result, measures of technology use are likely to be biased. Even non-technology measures may be affected, especially for certain subpopulations (such as Americans ages 65 and older) where the segment of the group comfortable with the internet may be very different from those who are not. Such patterns of bias can affect not just the survey’s point estimates but correlations and other internal relationships in the data. Users of Web-only surveys must be mindful of potential errors and biases associated with online surveys.
Methods
This study is based on an analysis of data from the American Trends Panel (ATP), created by the Pew Research Center and managed by Abt SRBI. The Abt SRBI panel team included Chintan Turakhia, Charles DiSogra, Courtney Kennedy, Nick Bertoni, Marci Schalk, Robert Magaw, Emily Martinez, Allison Ackermann and Sandra Hernandez.
The ATP is a nationally representative panel of randomly selected U.S. adults living in households. Respondents who self-identify as internet users and who provided an email address participate in the panel via monthly self-administered Web surveys, and those who do not use the internet, do not have an email address, or refuse to provide their email address participate via the mail.
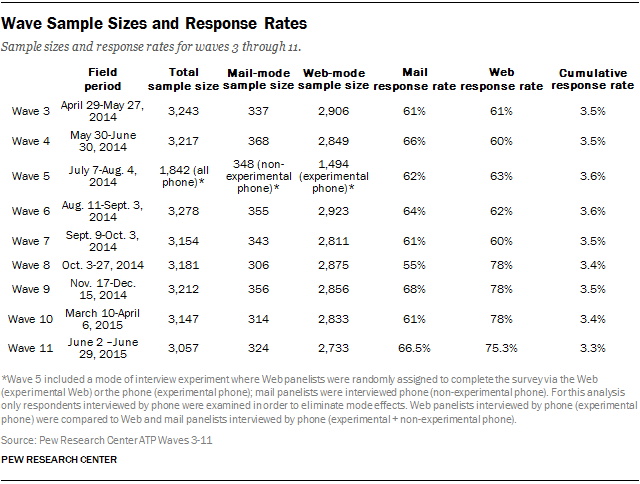
Data in this report are drawn from the third through 11th waves of the panel conducted in 2014 and 2015. Additional information including field dates, response rates and sample sizes can be found in the table below.
All current members of the American Trends Panel were originally recruited from the 2014 Political Polarization and Typology Survey, a large (n=10,013) national landline and cellphone random digit dial (RDD) survey conducted January 23 through March 16, 2014, in English and Spanish. At the end of that survey, respondents were invited to join the panel. The invitation was extended to all respondents who use the internet (from any location) and a random subsample of respondents who do not use the internet. When data collection for the 2014 Political Polarization and Typology Survey began, non-internet users were subsampled at a rate of 25%, but a decision was made shortly thereafter to invite all non-internet users to join from February 6, 2014, through the end of the field period. In total, 83% of non-internet users were invited to join the panel. Originally all internet users who did not have an email address were invited to join the panel (and participate via the non-Web mode) but were then subsampled after this date at a rate of 25%. Finally, all internet users who refused to provide an email address were originally invited to join the non-Web mode portion of the panel but after this date were no longer invited to join the panel.
Of the 10,013 adults interviewed, 9,809 were invited to take part in the panel. A total of 5,338 agreed to participate and provided either a mailing address or an email address to which a welcome packet, a monetary incentive and future survey invitations could be sent. Panelists also receive a small monetary incentive after participating in each wave of the survey.
The ATP data were weighted in a multi-step process that begins with a base weight incorporating the respondents’ original survey selection probability and the fact that some panelists were subsampled for invitation to the panel. Next, an adjustment was made for the fact that the propensity to join the panel and remain an active panelist varied across different groups in the sample. The final step in the weighting uses an iterative technique that matches gender, age, education, race, Hispanic origin and region to parameters from the U.S. Census Bureau’s 2013 American Community Survey. Population density is weighted to match the 2010 U.S. Decennial Census. Telephone service is weighted to estimates of telephone coverage for 2015 that were projected from the January-June 2014 National Health Interview Survey. It also adjusts for party affiliation using an average of the three most recent Pew Research Center general public telephone surveys and for internet use using as a parameter a measure from the 2014 Survey of Political Polarization. Sampling errors and statistical tests of significance take into account the effect of weighting. The Hispanic sample in the American Trends Panel is predominantly native born and English speaking.
For this report, two weights were created for each wave of data collection. The first weights the total sample, including the Web and mail panelists, to demographic targets of all U.S. adults living in households. The second weights only the Web-mode portion of the panel to these same total population targets. Note that wave 5 of data collection included a mode of interview experiment, which randomly assigned Web panelists to be interviewed by Web or phone; mail panelists were interviewed by phone. For the analysis in this report, Web panelists interviewed by phone are compared to Web and mail panelists interviewed by phone in order to examine the coverage difference between the two groups without introducing mode effects.
As noted earlier in the report, all differences of 3 percentage points or larger are statistically significant, as are most of those with a 2-point difference and some with just a 1-point difference. Accordingly, the focus here is on differences that are large enough to be substantively meaningful. In addition to sampling error, one should bear in mind that question wording and practical difficulties in conducting surveys can introduce error or bias into the findings of opinion polls.
The following table shows the field periods, unweighted sample sizes and response rates for each wave. The cumulative response rate takes account of the response rate for the 2014 Survey of Political Polarization (10.6%) and attrition from panel members who were removed at their request or for inactivity.