Despite the advances women have made in the workplace, they still account for a small share of top leadership jobs. That’s true in the fields of politics and government, academia, the nonprofit sector – and particularly business.

Women held only about 10% of the top executive positions (defined as chief executive officers, chief financial officers and the next three highest paid executives) at U.S. companies in 2016-17, according to a Pew Research Center analysis of federal securities filings by all companies in the benchmark Standard & Poor’s Composite 1500 stock index. And at the very top of the corporate ladder, just 5.1% of chief executives of S&P 1500 companies were women.
Nor do many women hold executive positions just below the CEO in the corporate hierarchy in terms of pay and position. Only 651 (11.5%) of the nearly 5,700 executives in this category, which includes such positions as chief operating officer (COO) and chief financial officer (CFO), were women. Although this group in general constitutes a significant pool of potential future CEO candidates, the women officers we identified tended to be in positions such as finance or legal that, previous research suggests, are less likely to lead to the CEO’s chair than other, more operations-focused roles.
Within the 11 broad economic sectors into which the 1500 companies are divided, in no case did women make up even a fifth of CEOs or non-CEO top executives. Nor do those levels appear likely to rise much anytime soon. A 2017 survey of corporate human-resource heads at large U.S. companies found that women made up only 10% of the short-term CEO candidate pool (i.e., people who’d be considered for promotion to CEO within the next three years). Looking out further, three to five years in the future, raised the share of women in the CEO candidate pool only to 15%.
This research builds on and extends previous work by other researchers that has found low levels of women leaders in major U.S. companies. To arrive at our count of women in top executive positions, we looked at compensation reports filed by all S&P 1500 companies with the U.S. Securities and Exchange Commission in calendar year 2017, most of which covered company fiscal years that ended in 2016 or early 2017. (We chose this time frame because fiscal years vary so much from company to company.)
We chose the Standard & Poor’s Composite 1500 index as our measure of corporate America because of its broad coverage, which spans all industries and all but the smallest publicly traded companies. The 1500 combines three other commonly used stock indices: the S&P 500 (companies with total stock-market value of $6.1 billion or more), the S&P MidCap 400 (market values of $1.6 billion to $6.8 billion), and the S&P SmallCap 600 (market values of $450 million to $2.1 billion). To be included, companies must, among other things, be listed on a U.S. stock exchange and either be headquartered in the U.S. or have at least a plurality of their business here. Companies in the 1500 are organized into 11 broad sectors and 67 primary industries. Altogether, the S&P 1500 covers 90% of total U.S. market capitalization, according to S&P Dow Jones Indices.
In general, the SEC requires companies to report detailed pay information for their CEO, CFO and the next three highest paid executives. Collectively referred to as “named executive officers,” this group often are considered by leadership researchers as equivalent to a company’s top management team; they not only include the CEO but also are a reservoir of potential CEOs, either for their own company or another one. In our analysis, we looked at CEOs and non-CEO top executives separately. (We excluded any executives who had left their company by the time the compensation report was filed.)
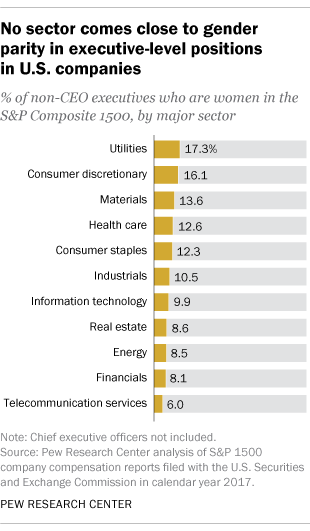
The share of non-CEO top executives who were women differed little by company size (as represented by the S&P 1500’s three size-based component indices), but did vary considerably by broad sector and specific industry. The sector with the highest share of women in such positions was utilities, with 17.3%; utilities also had the biggest share of female CEOs, with 10 out of 54 or 18.5%.
In the consumer discretionary sector, a diverse category that includes makers and sellers of everything from cars to handbags and service providers ranging from hotels and restaurants to wedding planners and broadcasters, 16.1% of non-CEO top executives were women. By comparison, only three of the 50 non-CEO top executives identified by the 13 telecommunications companies in the index, or 6%, were women. Telecom also was the only sector with no women CEOs.
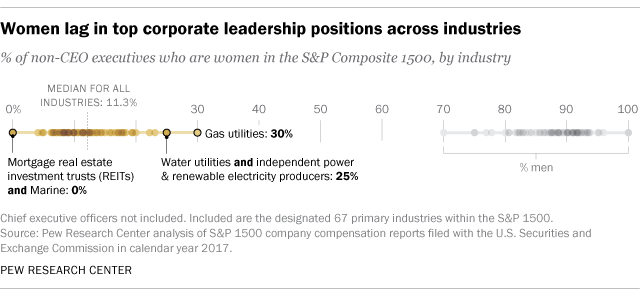
Taking the analysis down to the industry level revealed that women CEOs and non-CEO top executives both were heavily concentrated in a handful of industries. More than half (43) of the 77 female CEOs worked in just 10 industries, with eight of them heading specialty retailers. Nearly half (31) of the 67 industries represented in the index had no female CEOs at all. Similarly, about half (53.3%) of the female non-CEO top executives worked in just 15 industries. Specialty retail led the way here as well, with 49 non-CEO top executives who were women. By percentage share, the leading industry was gas utilities: 12 of the 40 non-CEO top executives reported by those companies, or 30%, were women.
What specific positions did those women hold? Our analysis found them to be highly concentrated in just a few types of corporate jobs: 168 (25.8%) were the CFOs of their companies, while another 19 held other finance positions, such as controller or chief accounting officer. (In fact, women made up 11.2% of all CFOs, versus 5.1% of CEOs.) Nearly a quarter (23.7%) of the female second-tier executives were corporate general counsels or chief legal officers, and nearly 10% were chief human resources officers or the equivalent.
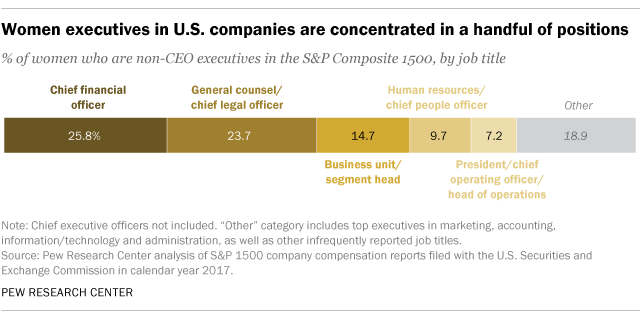
In addition, 47 women non-CEO top executives (7.2% of the total) were designated president, COO or a similar title, and 96 (14.7%) were the heads of major subsidiaries or operating divisions. The relative scarcity of women in high-level operational roles may be significant, because management researchers have found that, generally speaking, companies and their boards (who formally appoint the CEO) prefer to have people with operational experience in the top spot.
The executive recruiting firm Crist Kolder, for instance, found that more than three-quarters of CEOs at large U.S. companies had been either COOs, divisional presidents or operating executives immediately before getting the top job; 6.7% had been CEOs at other companies, while 4.1% were founders. Only about 11% had gone directly from CFO or some other top executive job to the CEO chair.
[ing]
