
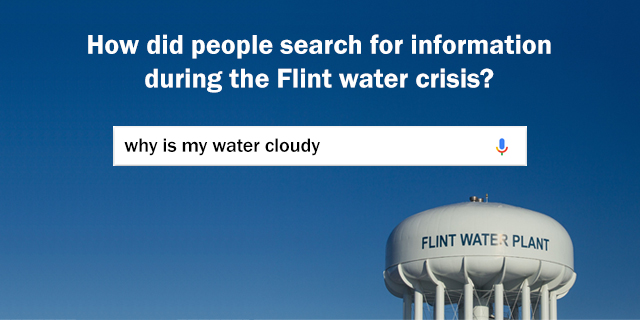
How did Americans use Google to learn about the water contamination crisis in Flint, Michigan, and how did their online searches evolve over time? These questions are at the center of a new Pew Research Center study that analyzes 18 months’ worth of Google search data to track public interest in the multilayered crisis in Flint.

While the study focuses on one particular news event, it sheds light on broader research questions, most prominently what aggregated internet search queries can tell us about how news spreads in today’s digital news environment. Amy Mitchell, director of journalism research at Pew Research Center, helped author the study; what follows is an edited interview with Mitchell about the methodology of the report.
Why did you focus on the Flint water crisis?
Although our research interests are broad, we felt using a case study would allow us to deeply examine the nuances of public interest in a news topic as the story unfolds. We wanted a story with many unique internet search keywords, as well as a precise geographic area, both of which tend to allow for more accurate tracking of internet search activity. We also hoped to have a news story that people could connect with at many levels. The Flint case meets these criteria. There are many search keywords that are specific to the Flint crisis. It also had a long timeline, evolved from a local issue to a national one and became a story with impact at the personal, community and political levels.
This report is different from many Pew Research Center analyses in that it doesn’t use survey data. How was this report done?
At Pew Research Center, we employ many methodologies in our research, depending on the questions we are trying to answer. These methodologies include original analyses of large external datasets, which is what we did here. This was our first use of data from the Google Health API, which is essentially an access point for analyzing large amounts of data about the terms that internet users searched for during a given period.
Our team spent several months making sure we fully understood the data, how it is organized and the best methods for obtaining accurate data returns before we embarked on the Flint study itself. Once we felt confident in the methods, the team extracted the results of the queries across the 130 weeks of this study, took a number of statistical steps to clean the dataset and then began our internal analyses.
Why did you use Google search data, specifically?
While no search engine can represent the queries of all Americans, a vast majority of online searchers use Google, and a number of researchers are experimenting with its use as a tool for understanding the public’s attitudes and behaviors. For this project, we applied to Google and were given access to the private Google Health API, which provides more granular data than the public Google Trends website.
What can you learn from this kind of search data? Can search data provide a representative sample of some population?
The way the data are returned is not at the user level, but at the individual search query level. In other words, the unit of analysis is searches, not people. It’s important to remember that data is shown as a proportion of all searches in the geographic area for that time period, not the total volume. So, for example, when we talk about increases in search activity for personal health-related terms in Michigan, that means searches for those items were a larger portion of all searches in the state of Michigan that week, compared with the prior week.
What challenges did you encounter in using search data?
As with any new data source or tool, a number of challenges emerged as we worked to fully understand what the data represent, what they don’t represent and how best to structure an accurate analysis. Many of the challenges are discussed in detail in the methodology, so I’ll just highlight one example here.
For any query, the Google Health API pulls a sample of searches. Results can vary quite a bit from query to query based on the sample that is pulled. To address this variation, we drew 50 samples for each search category in each geographic area for each week over the 2 ½ years studied, resulting in a total of 91,000 samples. Then, for each week, we took the average of the 50 samples.
Another aspect of this report involved tracking news coverage related to the Flint crisis. How did you go about doing that?
The goal of this part of the project was to capture broad media coverage volume over time; it was not to conduct a detailed media content analysis. To do this, we collected news stories from a sample of local, regional and national news media for the same time range as the Google search data. We included everything that could be identified as being about the Flint water crisis. The identification was a two-step process: First, keyword searches were used to identify and capture any possible related stories. Then, a team of coders read or watched each story to verify that at least 50% of it was about the Flint water crisis.
Does this project hold any lessons or caveats for other researchers who might want to use search data to assess Americans’ interest in news events?
Absolutely. We wrote about several of them in a post on Medium, but a few key points to keep in mind are that Google Trends measures search activity, not opinion or priority. While search activity often can be linked to interest, it does not indicate positive or negative opinions on the part of the public, or that a search term that returns more results is more important than some other term. Also, in keyword searches, terms must be exact, which means that every conjugation of a word or combination of words needs to be entered separately. For example, if someone wants to see search activity around “lead testing,” you need to enter “lead tests,” “lead testing,” “lead tested” and “lead test.” For us, this meant using nearly 2,700 different search terms.
