
It’s springtime, which means the start of the budgeting process for Congress and a mad dash for many Americans to file their income taxes. That makes it a good time to look at the federal government’s spending habits in a broader context than just this year’s battles.
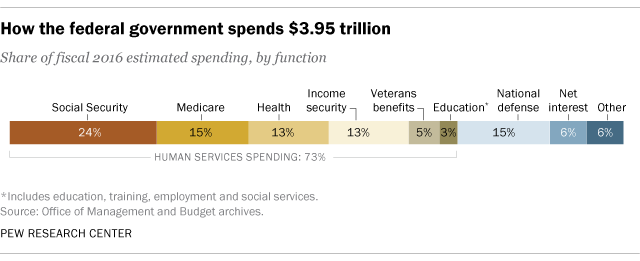
When thinking about federal spending, it’s worth remembering that, as former Treasury official Peter Fisher once said, the federal government is basically “a gigantic insurance company,” albeit one with “a sideline business in national defense and homeland security.” In fiscal year 2016, which ended this past Sept. 30, the federal government spent just under $4 trillion, and about $2.7 trillion – more than two-thirds of the total – went for various kinds of social insurance (Social Security, Medicaid and Medicare, unemployment compensation, veterans benefits and the like). Another $604 billion, or 15.3% of total spending, went for national defense; net interest payments on government debt was about $240 billion, or 6.1%. Education aid and related social services were about $114 billion, or less than 3% of all federal spending. Everything else – crop subsidies, space travel, highway repairs, national parks, foreign aid and much, much more – accounted for the remaining 6%.
It can be helpful to look at spending as a share of the overall U.S. economy, which provides a consistent frame of reference over long periods. In fiscal 2016, total federal outlays were 21.5% of gross domestic product, or GDP. For most of the past several decades, federal spending has hovered within a few percentage points above or below 20%. The biggest recent exception came in the wake of the 2008 mortgage crash: In fiscal 2009, a surge in federal relief spending combined with a shrinking economy to push federal outlays to 24.4% of GDP, the highest level since World War II, when federal spending peaked at nearly 43% of GDP. (We relied on archived historical data from former President Barack Obama’s final budget for our spending data; President Donald Trump’s initial budget proposal doesn’t include any historical data.)
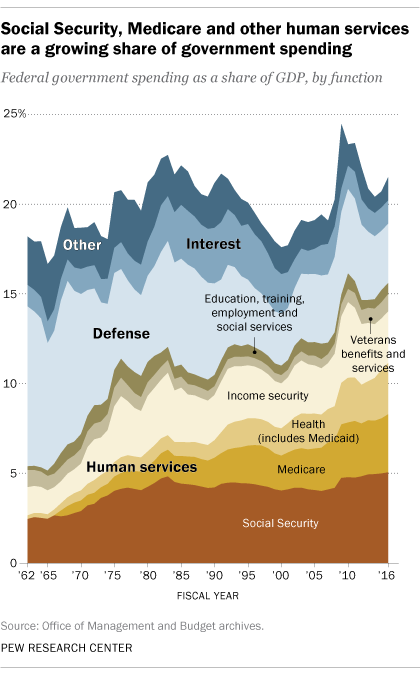
Measured as a share of GDP, the biggest long-term growth in federal spending has come in human services, a broad category that includes various kinds of social insurance, other health programs, education aid and veterans benefits. From less than 1% of GDP during World War II (when many Depression-era aid programs were either ended or shifted to the war effort), federal spending on human services now amounts to 15.5% of GDP. It actually was higher – 16.1% – in fiscal 2010, largely due to greater spending on unemployment compensation, food assistance and other forms of aid during the Great Recession. Now, the main growth drivers of human-services spending are Medicaid, Medicare and Social Security.
While spending on human services has grown to represent a greater share of GDP over time, the defense share has become smaller: It was 3.3% in fiscal 2016, versus 4.7% as recently as fiscal 2010. In general, and perhaps not surprisingly, defense spending consumes more of GDP during wartime (well over a third at the height of World War II) and less during peacetime. The major exception was the Reagan-era military buildup (which actually accelerated a buildup that began late in the Carter administration): From a post-Vietnam low of 4.5% of GDP in fiscal 1979, defense spending eventually peaked at 6% of GDP in fiscal 1986.
Besides human services and national defense, the next-biggest category of federal spending is interest on public debt. Excluding interest paid to government trust funds (such as the Social Security and military-retirement trust funds) and various other small government loan programs, the $240 billion in net interest paid on federal debt in fiscal 2016 represented 1.3% of GDP. Even though total public debt has continued to grow (it stood at nearly $19.96 trillion in February, hitting the statutory debt limit), the dollar amount of actual interest paid fluctuates with the general interest rate environment. Rates are quite low now, but they were much higher in the 1980s and 1990s; in those decades, net interest payments often approached or exceeded 3% of GDP.
Related posts:
