As of this month, the U.S. economy’s recovery from the Great Recession is five years old. But given how most Americans rate it, they can be forgiven for not feeling much in the mood for cake and ice cream.
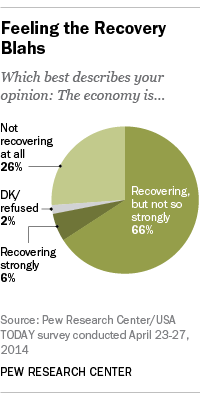
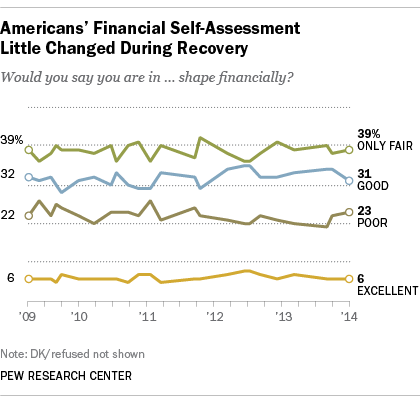
In a Pew Research Center survey from April, only 6% of Americans said the economy was recovering strongly. Two-thirds (66%) said the economy was recovering, but not very strongly; about a quarter (26%) said it wasn’t recovering at all. The same survey found that Americans’ financial self-assessment had barely budged since June 2009, when the recession officially ended: 37% rated their financial situation “excellent” or “good,” 39% “only fair,” and 23% “poor.”
That persistent economic pessimism is warranted. By several measures — gross domestic product, personal income, job growth and employment ratio — the current recovery is among the weakest on record, particularly given its duration. Unless the economy’s official scorekeepers change their minds, the recovery already has lasted 60 months — the fifth-longest expansion since the end of World War II. (Economists divide economic cycles into two phases: expansion (or recovery) and recession. The current recovery is considered to have begun in June 2009, the trough of the recession that started when the economy peaked in December 2007.)
We compared the current recovery’s performance on several metrics against the first five years of the other longest-running expansions — those of 1961-69, 1982-90, 1991-2001 and 2001-07. By almost every measure, the current recovery has lagged well behind those of the past.

Consider the broadest measure of economic activity, gross domestic product. Since the second quarter of 2009 (GDP is measured quarterly, not monthly), inflation-adjusted GDP has risen just 10.8% — the slowest growth of any of the five-year periods examined. In fact, as far as GDP goes each recovery since the 1960s has been weaker than the last (see chart).
This recovery is also dogging it on putting people back to work. Since June 2009, the number of nonfarm payroll jobs in the U.S. has grown by just 5.7% — lower job growth than all but one of the prior lengthy expansions. In the first five years of the 1960s recovery, for instance, payrolls grew 17.3%. They grew 16.4% during the first five years of the 1980s “Reagan recovery,” and 9.6% during the first five years of the tech-fueled boom of the 1990s.
In every previous recovery before this one, the employment-population ratio — the share of the total civilian population who are employed — has risen (though often not right away, as the jobs cycle typically lags the economic cycle). But this time around, the ratio, which stood at 62% just before the late-2008 financial panic, has bounced between 58% and 59% since September 2009. (Some of that, along with the related decline in the labor force participation rate, likely is due to the impact of Baby Boomers retiring, though analysts disagree on just how much.)
Given the torpid jobs performance, it comes as little surprise that personal income also has lagged. According to the Bureau of Economic Analysis, per-capita disposable income (after adjusting for inflation) has grown just 3.2% since mid-2009, to $37,038 as of the first quarter of 2014. In previous recoveries, it was much higher: 11.6% in the first five years of the 2001-07 recovery, and 8.7% in the first five years of the 1990s tech boom.

One metric about the current recovery, however, jumps out: the stock market. The benchmark S&P 500 index has more than doubled over the course of the recovery, by far its largest gain of any of the periods we looked at. The index surpassed its pre-crash high in March 2013, and has gone on since to a series of new record highs. (Of course, that’s not much comfort to the 44% of Americans who say they don’t own stocks.) On another closely tracked measure, the economy regained all of its lost payroll jobs just last month. But even that measure doesn’t take into account the population growth during that period. What the chart doesn’t show is that there are about 15 million more working-age people now than there were in January 2008, but essentially the same number of jobs.
Americans today are slightly more optimistic about the job market than they were near the start of the recovery, but not much: In the April Pew Research survey, 27% said there were plenty of jobs available in their local area (up from 11% in October 2009), but 65% said jobs were still hard to find, versus 79% in the 2009 survey.
