

One of the biggest and most difficult items on President Obama’s Asia agenda has been trade — in particular, unsnarling negotiations for the proposed Trans-Pacific Partnership (TPP) free-trade agreement. The TPP would remove trade barriers among 12 nations on both sides of the Pacific that together account for about 40% of the global economy. But as might be expected, the ambitious deal has run into resistance abroad (especially from the Japanese agricultural and auto industries) and has revived long-running debates in the U.S. about the benefits and risks of such trade deals. (Two of the four countries on Obama’s schedule, Japan and Malaysia, are participating in the talks; the other two, South Korea and the Philippines, have expressed interest in joining.)
The stakes are considerable. The dozen countries currently in the TPP talks include three of the top four U.S. trade partners — Canada (#1), Mexico (#3) and Japan (#4). While the U.S., Canada and Mexico have been linked since 1994 via the North American Free Trade Agreement, or NAFTA, TPP proponents see the deal as key to opening the Japanese market to foreign products. (In a recent Pew Research Center survey, 55% of Americans said the TPP would be a good thing for the U.S., while 25% said it would be a bad thing and 19% had no opinion. But nearly three-quarters (74%) of respondents favored increased trade with Japan.)
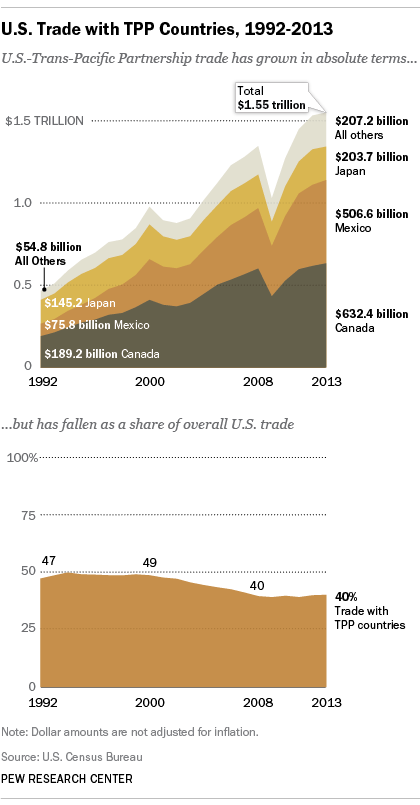
Last year, 40% of all U.S. overseas trade in goods was done with the 11 other TPP countries, according to our analysis of international trade data from the Census Bureau, for a total of $1.55 trillion in combined imports and exports. That share actually has fallen over the past two decades, mainly because China’s share rose so dramatically during the 2000s. The U.S. imported $852.1 billion in goods from TPP countries (37.6% of all imports) and exported nearly $698 billion in goods to them (44.2% of all exports). (The big drop in 2009 shows the impact of the global financial crisis; total U.S. imports fell nearly 26% that year, while exports fell almost 18%.)
While Canada, Mexico and Japan are by far the largest U.S. trade partners in the TPP group, trade has grown faster with other, smaller economies — and not just those on the Asian side of the Pacific Ocean. Since 1992, for instance, U.S. exports of goods to Peru have risen tenfold, while imports of Peruvian goods have grown even faster. Total trade in goods with Chile grew more than sevenfold between 1992 and 2013; the U.S. had a $7.2 billion trade surplus with Chile last year. And trade with Vietnam, all but nonexistent in 1992, totaled $29.7 billion last year; all but about $5 billion of that was imports.
New Zealand, Singapore, Chile and Brunei joined in the original TPP in 2005 (effective 2006). Since 2009, a growing list of countries has entered talks to join an expanded TPP; there have been 19 formal rounds of negotiations. But perhaps inevitably for such a big, complicated trade deal, the TPP has been beset by controversies over everything from intellectual property to catfish.
