The United States has been a polyglot country since before it was a country. As early as 1646, no fewer than 18 languages were spoken on Manhattan Island. German was common in colonial-era Pennsylvania. New York’s Dutch community held onto their language long after the English takeover of what had been New Amsterdam. And African slaves spoke dozens of native languages and dialects. But the nation’s continuing linguistic diversity is ever evolving and it can still spark controversy, as Coca-Cola discovered with its recent Super Bowl ad.
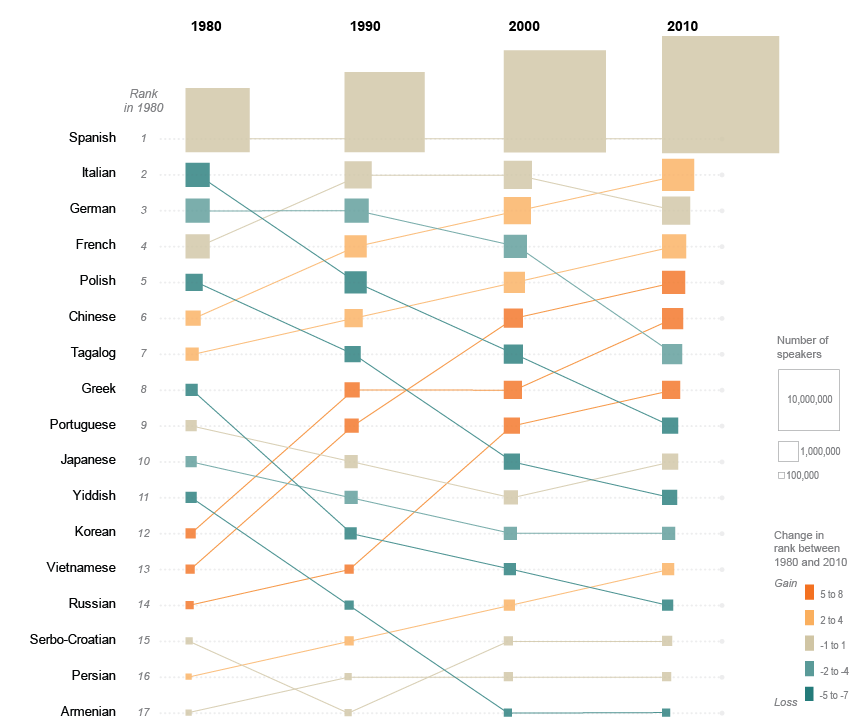
Language charts, such as this one by the U.S. Census, reflect the nation’s changing demographics. Spanish is overwhelmingly the most common non-English language, as it has been since the Census Bureau began detailed language surveys in the 1970s. According to the 2011 American Community Survey, nearly 13% of the population (37.6 million people) spoke Spanish or a Spanish creole at home. Beyond that, though, the chart illustrates the changing composition of the U.S. population.
In 1980, for instance, only about 630,000 people spoke Chinese at home; by 2001 nearly 2.9 million did. The number of Tagalog speakers more than tripled over that span, to about 1.6 million. By contrast, languages spoken by older immigrant groups continue to decline. In 2011, for example, only about 161,000 people reported speaking Yiddish at home, about half as many as in 1980. Note that because the chart only displays languages for which comparable data were available for all time periods, other widely spoken languages such as Arabic (952,000 speakers in 2011), Hindi (645,000) and Urdu (374,000) aren’t shown.
As one might expect, language prevalence varies considerably by geography. Chicago, for instance, retains a concentration of Polish speakers, while Arabic is the predominant language (other than English and Spanish) in the Detroit area.
