Numbers, Facts and Trends Shaping Your World

2014, Hispanics in the United States Statistical Portrait

*Visit the most recent data.

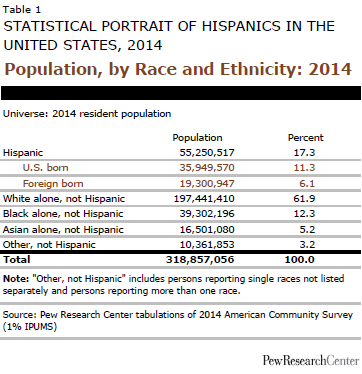
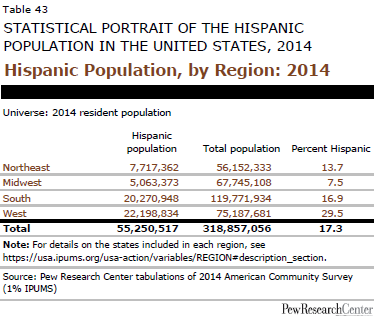
There were 55.3 million Hispanics in the United States in 2014, comprising 17.3% of the total U.S. population. In 1980, with a population of 14.8 million, Hispanics made up just 6.5% of the total U.S. population. Click on any of the bold headings below in the summary table to see detailed tables for each.

Click here for a PDF of all the tables below and read the accompanying report. Download the Excel workbook.

For a statistical portrait of the Foreign-born population in the United States, click here.


Statistical Portrait of Hispanics in the United States 2014
% of the Hispanic population, unless otherwise noted
Population/Hispanic Origin/Nativity/Language Use/Race
Population (#) 55,250,517
Mexican 64.0
Foreign born 34.9
Speaking English at least very well (ages 5 and older) 68.4
White 66.2
Age/Gender/Marital Status/Fertility
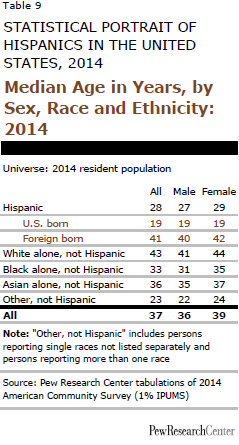
Median age (in years) 28
Female 49.5
Married (ages 18 and older) 46.1
Women ages 15-44 giving birth in past year 7.0
Educational Attainment and Enrollment (highest degree completed, ages 25 and older)
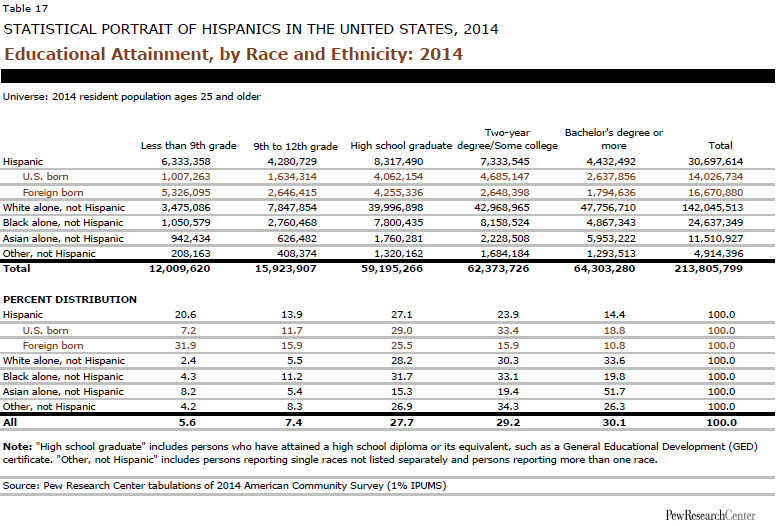
High school graduate or less 61.7
Two-year degree/Some college 23.9
Bachelor’s degree or more 14.4
Work/Earnings/Income (ages 16 and older)
In labor force (among civilian population) 67.0
Median annual personal earnings (in 2014 dollars, among those with earnings) $22,400
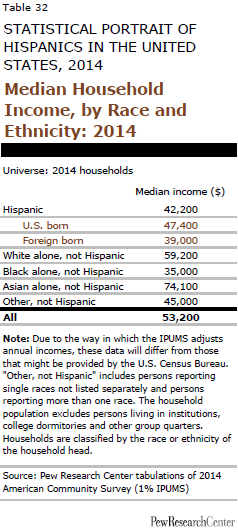
Median annual household income (in 2014 dollars) $42,200
Poverty/Government Assistance/Health Care
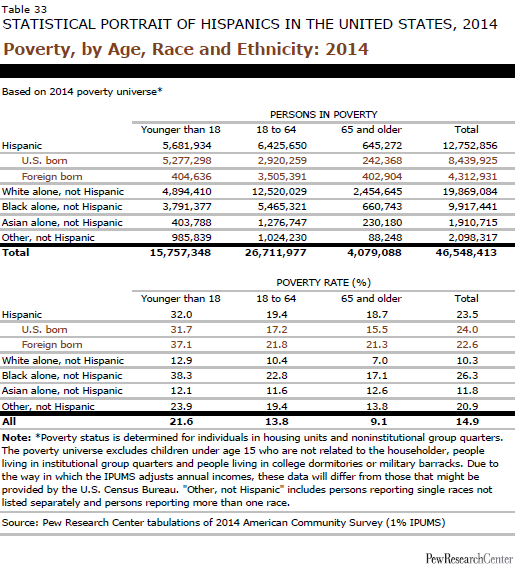
Living in poverty 23.5
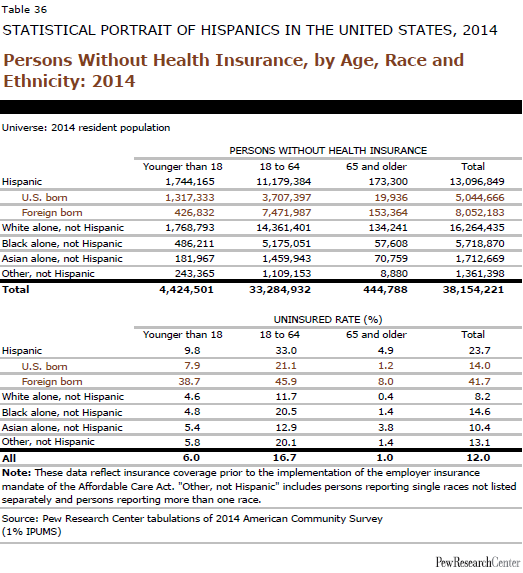
Uninsured 23.7
Homeownership and Household Characteristics
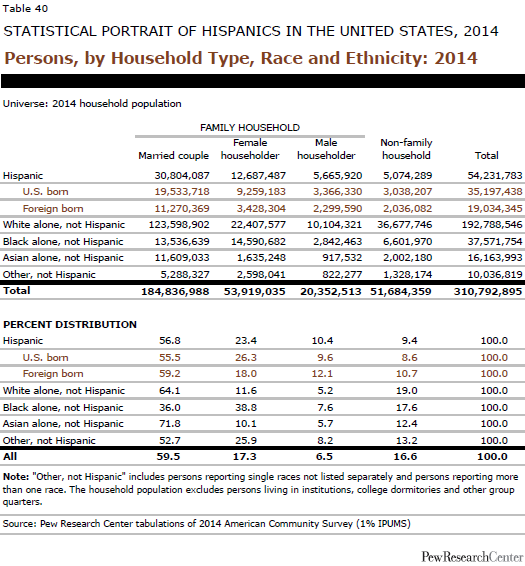
In family households 90.6
Region and Top Five States of Residence
West 40.2
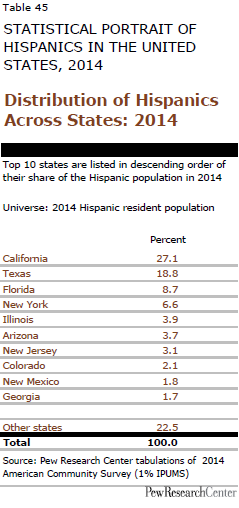
California 27.1
South 36.7
Texas 18.8
Florida 8.7
Northeast 14.0
New York 6.6
Midwest 9.2
Illinois 3.9
Source: Pew Research Center tabulations of 2014 American Community Survey (1% IPUMS)

Click on each heading below to expand and see detailed tables.

How we did this
Population/Hispanic Origin/Nativity/Language Use/Race

Population, by Race and Ethnicity: 2014
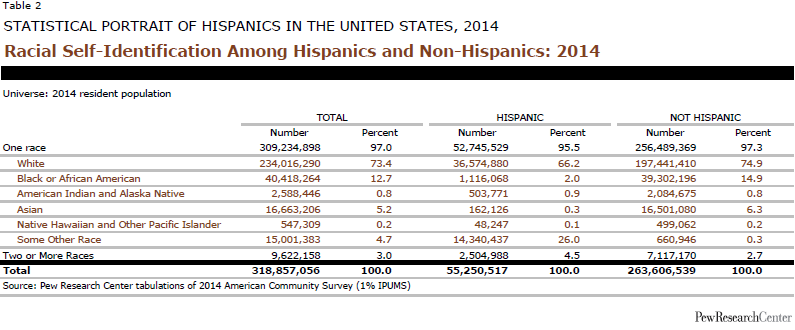
Racial Self-Identification Among Hispanics and Non-Hispanics: 2014
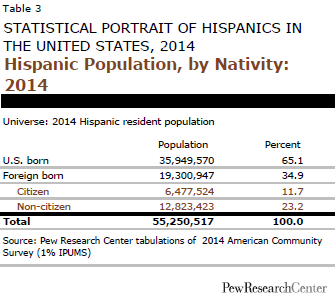
Hispanic Population, by Nativity: 2014
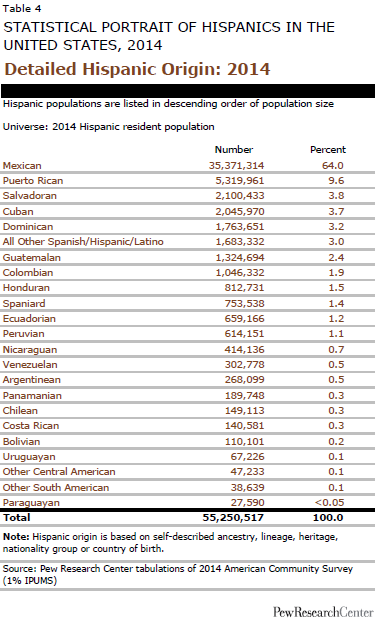
Detailed Hispanic Origin: 2014
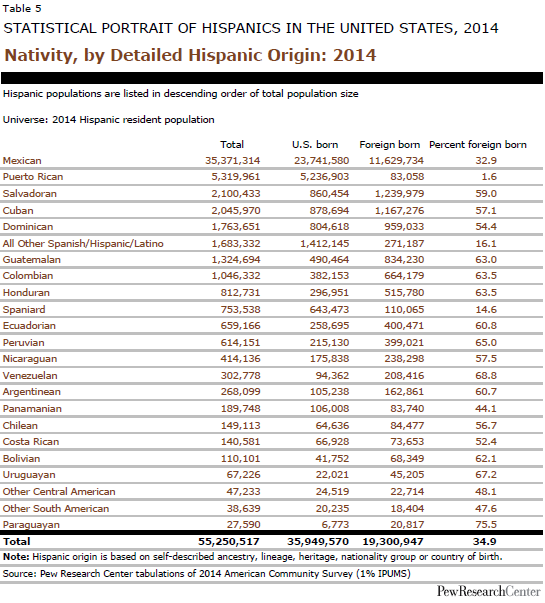
Nativity, by Detailed Hispanic Origin: 2014
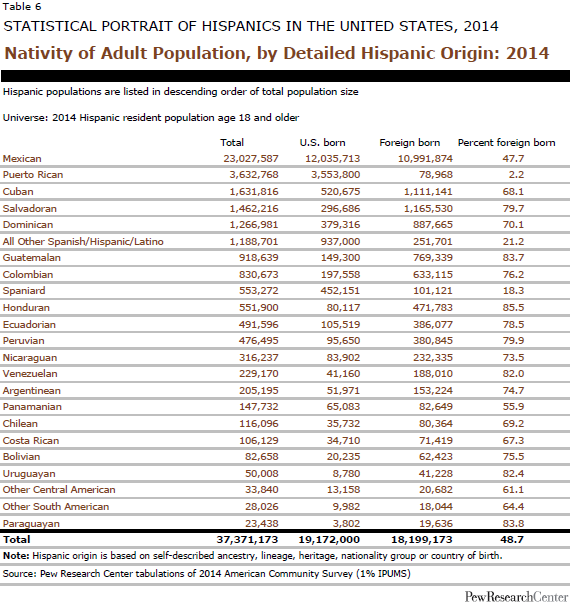
Nativity of Adult Population, by Detailed Hispanic Origin: 2014 
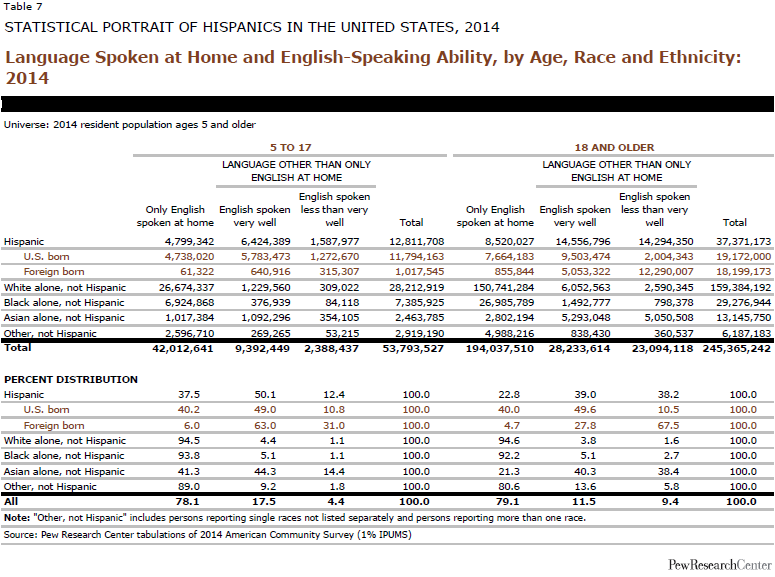
Language Spoken at Home and English-Speaking Ability, by Age, Race and Ethnicity: 2014
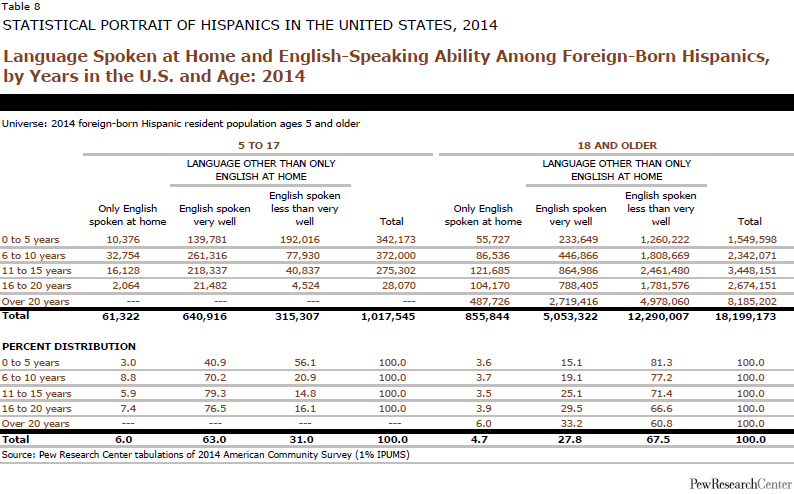
Language Spoken at Home and English-Speaking Ability Among Foreign-Born Hispanics, by Years in the U.S. and Age: 2014 

Back to top

How we did this
Age/Gender/Marital Status/Fertility

Median Age in Years, by Sex, Race and Ethnicity: 2014
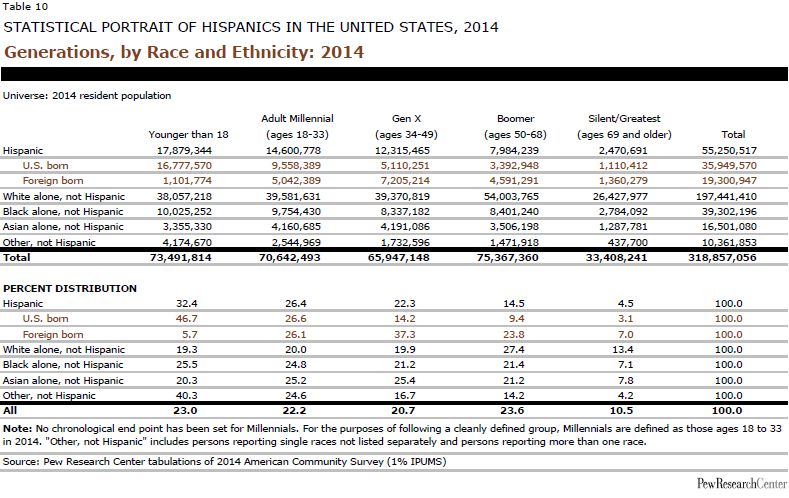
Generations, by Race and Ethnicity: 2014
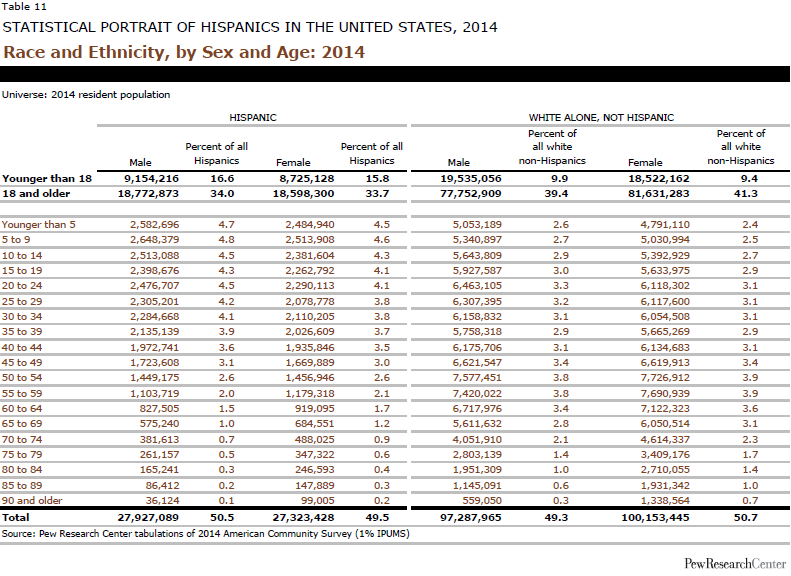
Race and Ethnicity, by Sex and Age: 2014
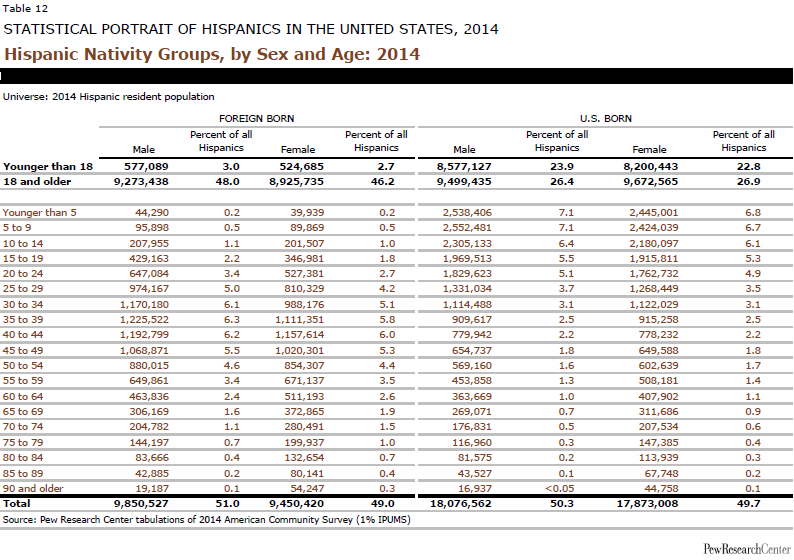
Hispanic Nativity Groups, by Sex and Age: 2014
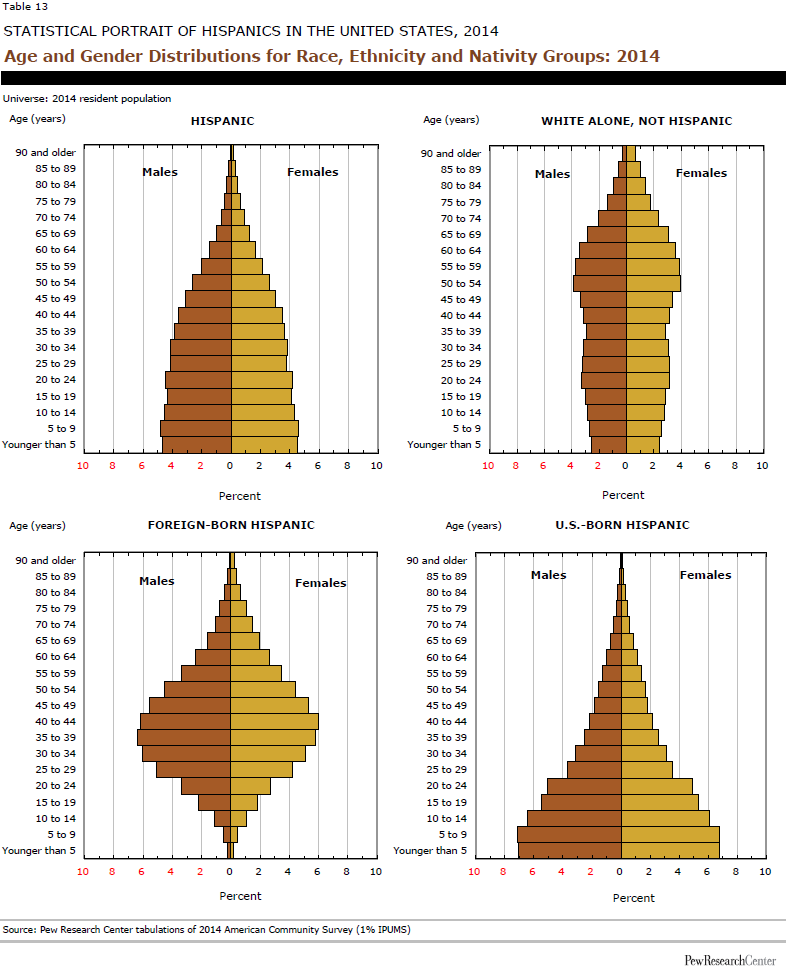
Age and Gender Distributions for Race, Ethnicity and Nativity Groups: 2014
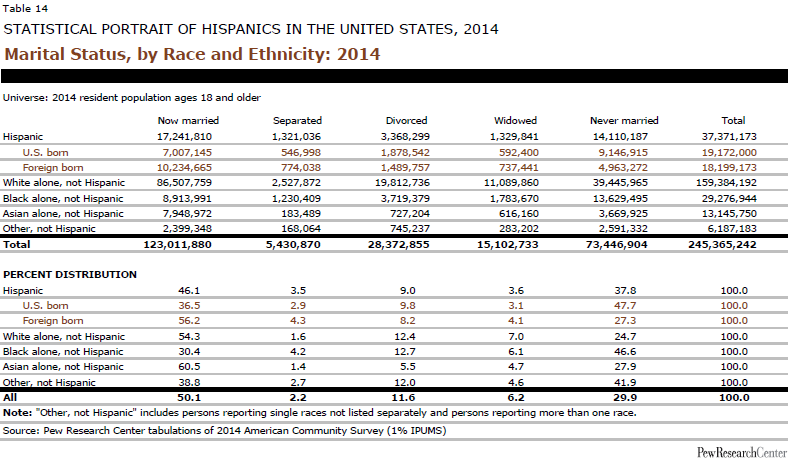
Marital Status, by Race and Ethnicity: 2014
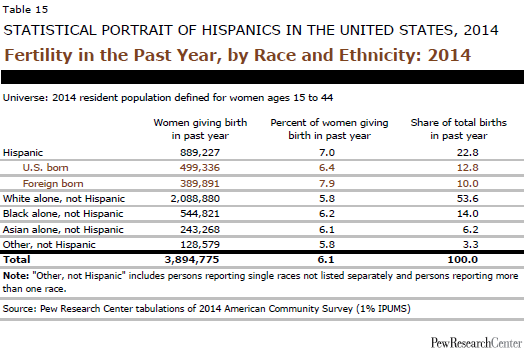
Fertility in the Past Year, by Race and Ethnicity: 2014 
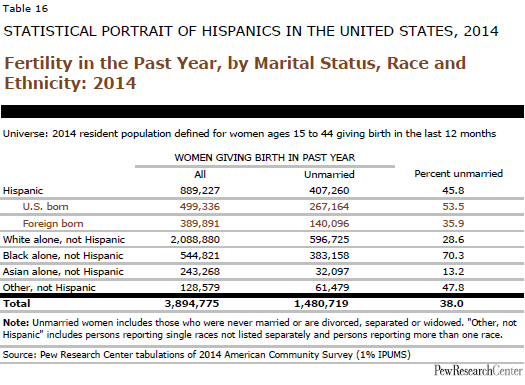
Fertility in the Past Year, by Marital Status, Race and Ethnicity: 2014

Back to top

How we did this
Educational Attainment and Enrollment

Educational Attainment, by Race and Ethnicity: 2014
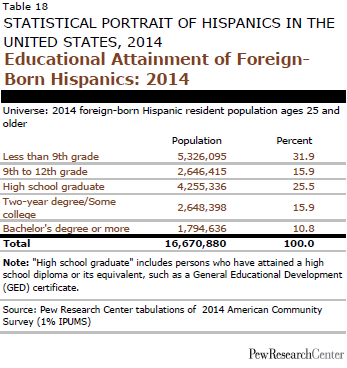
Educational Attainment of Foreign- Born Hispanics: 2014
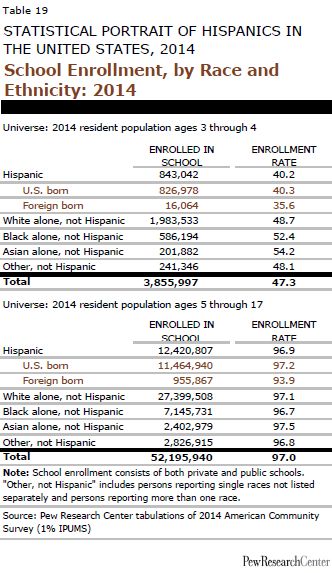
School Enrollment, by Race and Ethnicity: 2014
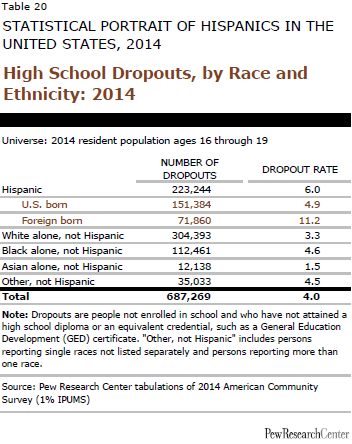
High School Dropouts, by Race and Ethnicity: 2014
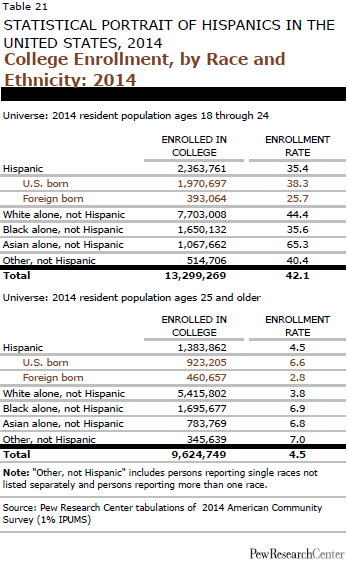
College Enrollment, by Race and Ethnicity: 2014

Back to top

How we did this
Work/Earnings/Income

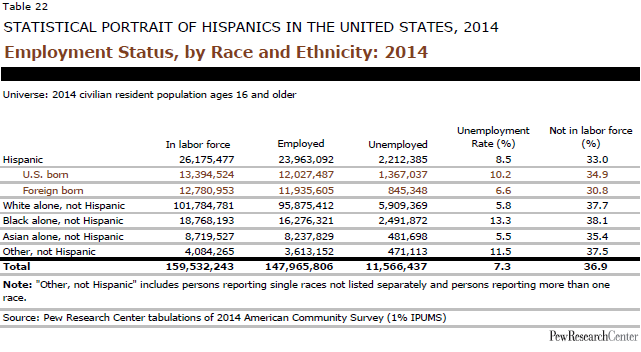
Employment Status, by Race and Ethnicity: 2014
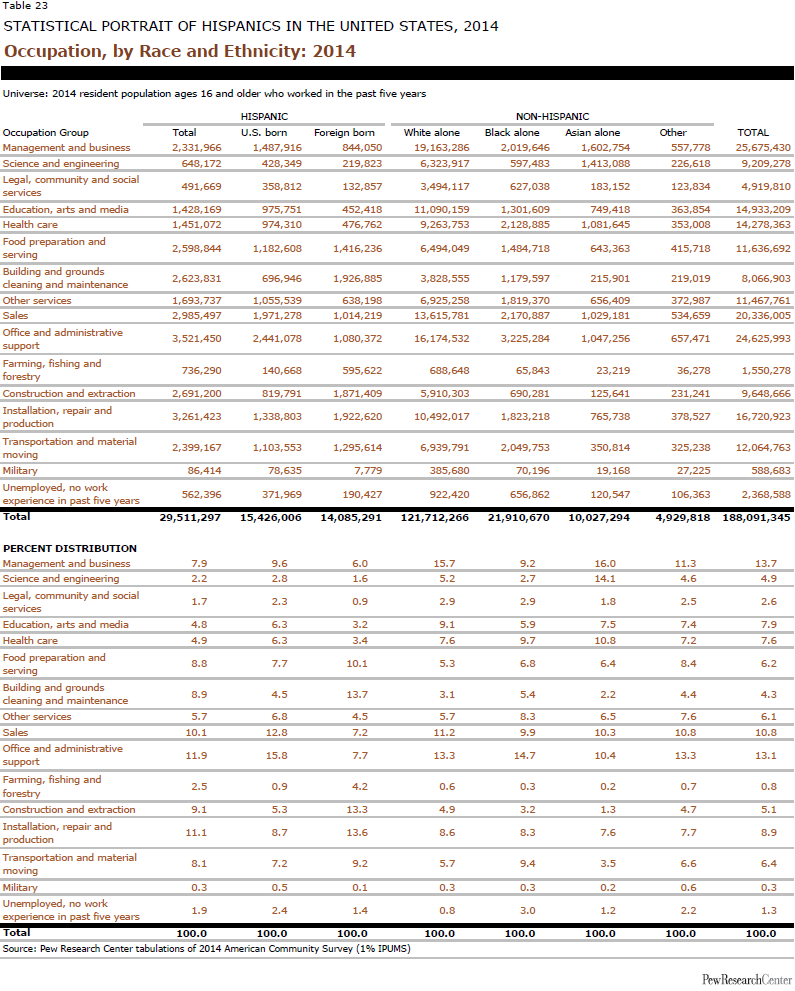
Occupation, by Race and Ethnicity: 2014
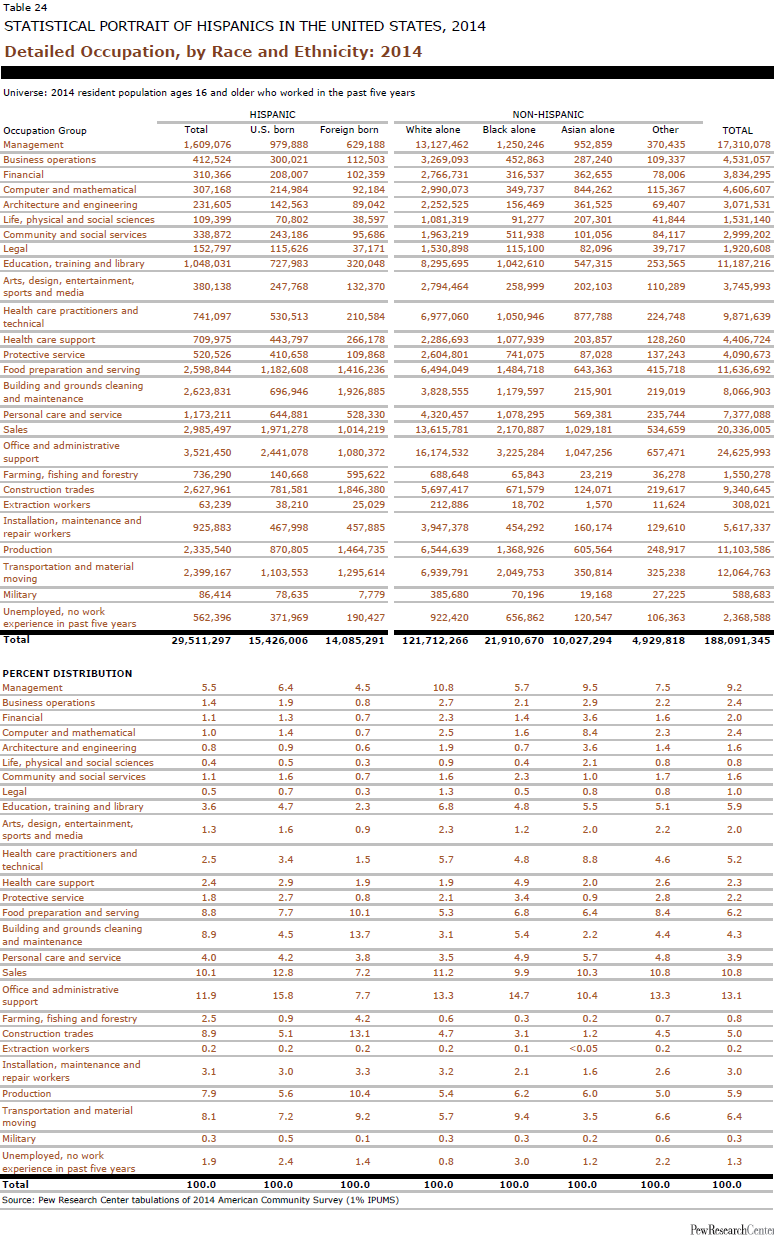
Detailed Occupation, by Race and Ethnicity: 2014
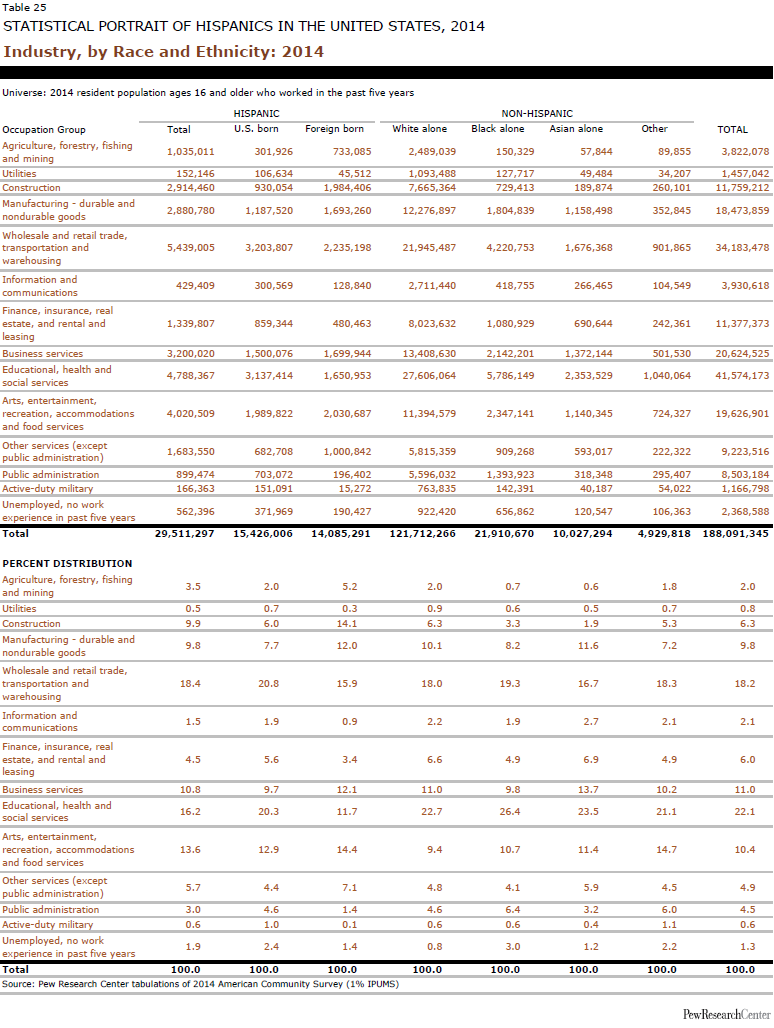
Industry, by Race and Ethnicity: 2014
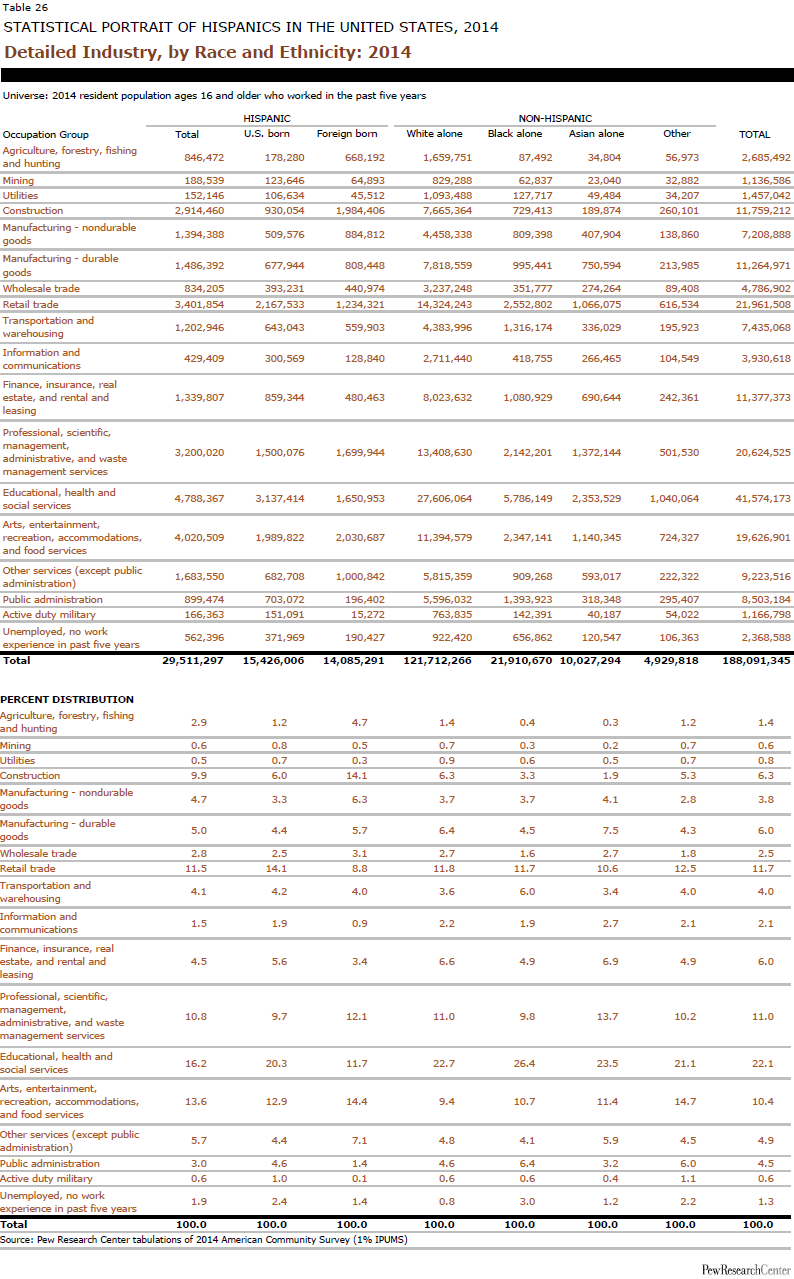
Detailed Industry, by Race and Ethnicity: 2014
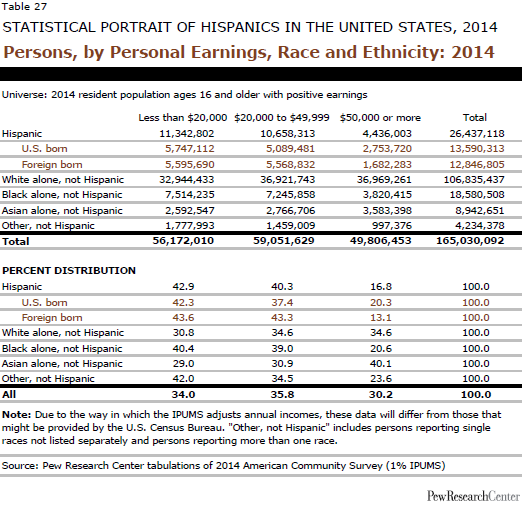
Persons, by Personal Earnings, Race and Ethnicity: 2014
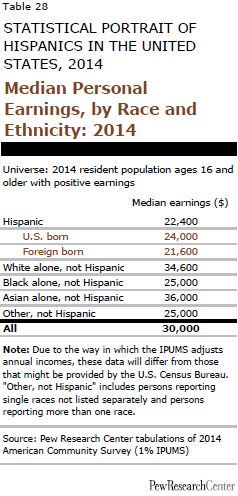
Median Personal Earnings, by Race and Ethnicity: 2014
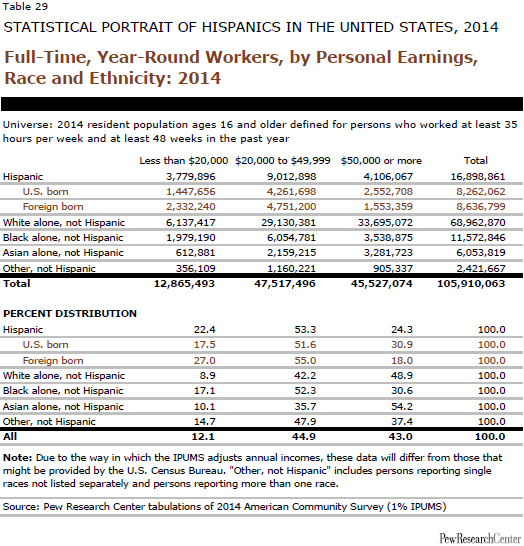
Full-Time, Year-Round Workers, by Personal Earnings, Race and Ethnicity: 2014
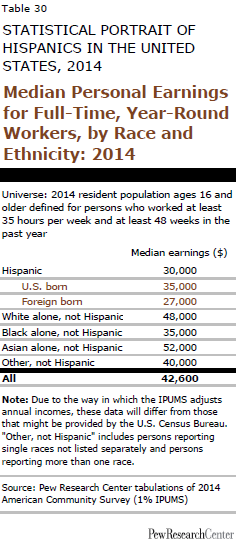
Median Personal Earnings for Full-Time, Year-Round Workers, by Race and Ethnicity: 2014
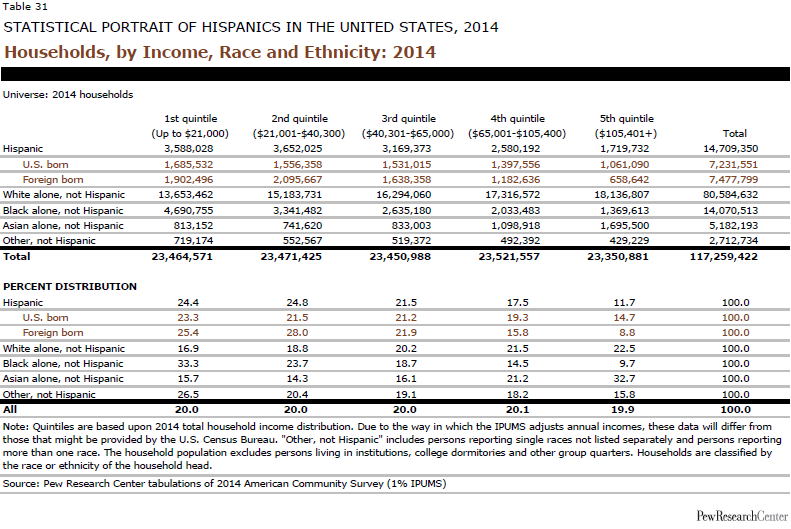
Households, by Income, Race and Ethnicity: 2014
Median Household Income, by Race and Ethnicity: 2014

Back to top

How we did this
Poverty/Government Assistance/Health Care

Poverty, by Age, Race and Ethnicity: 2014
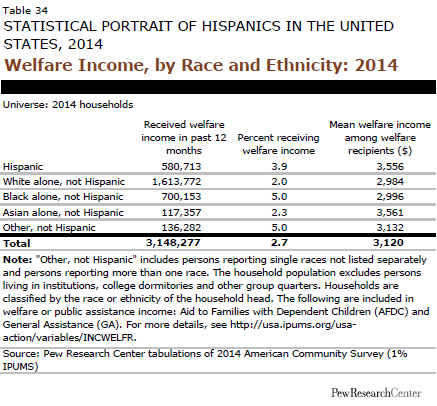
Welfare Income, by Race and Ethnicity: 2014 
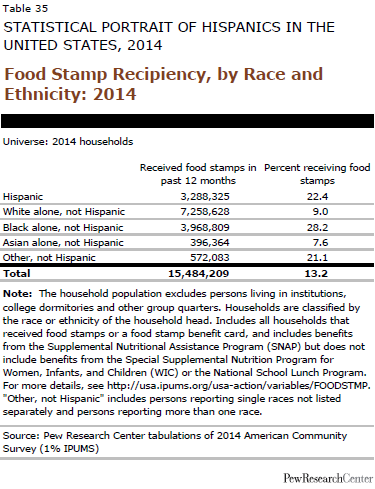
Food Stamp Recipiency, by Race and Ethnicity: 2014
Persons Without Health Insurance, by Age, Race and Ethnicity: 2014
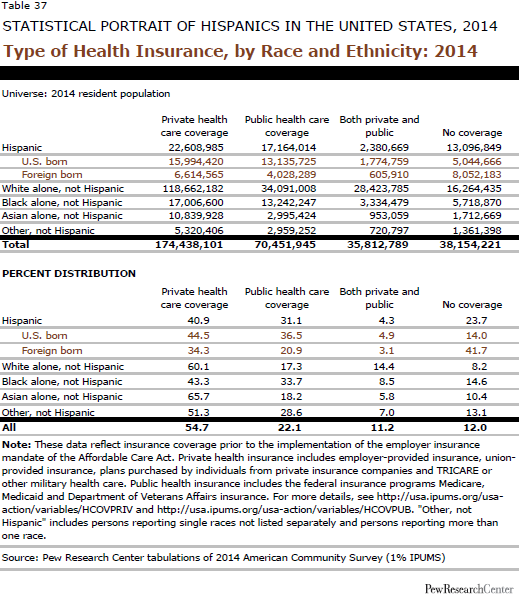
Type of Health Insurance, by Race and Ethnicity: 2014

Back to top

How we did this
Homeownership and Household Characteristics

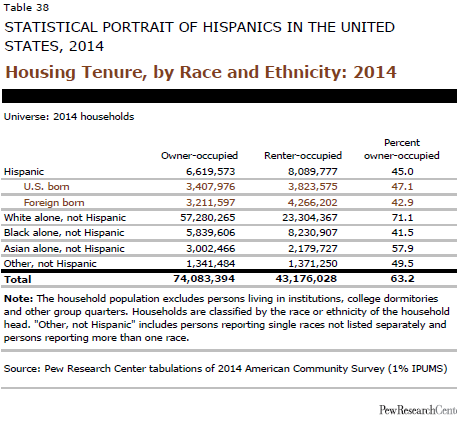
Housing Tenure, by Race and Ethnicity: 2014
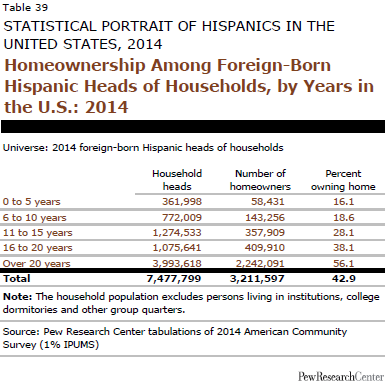
Homeownership Among Foreign-Born Hispanic Heads of Households, by Years in the U.S.: 2014
Persons, by Household Type, Race and Ethnicity: 2014
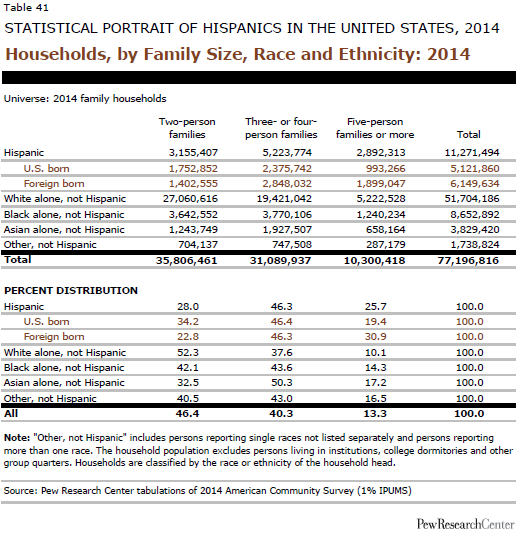
Households, by Family Size, Race and Ethnicity: 2014
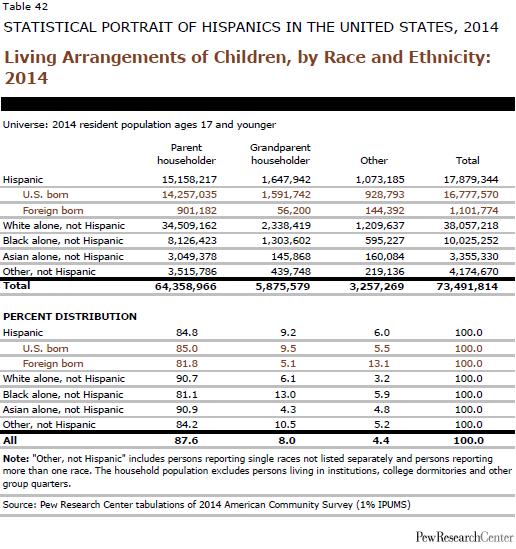
Living Arrangements of Children, by Race and Ethnicity: 2014

Back to top

How we did this
Region and Top Five States of Residence
Hispanic Population, by Region: 2014
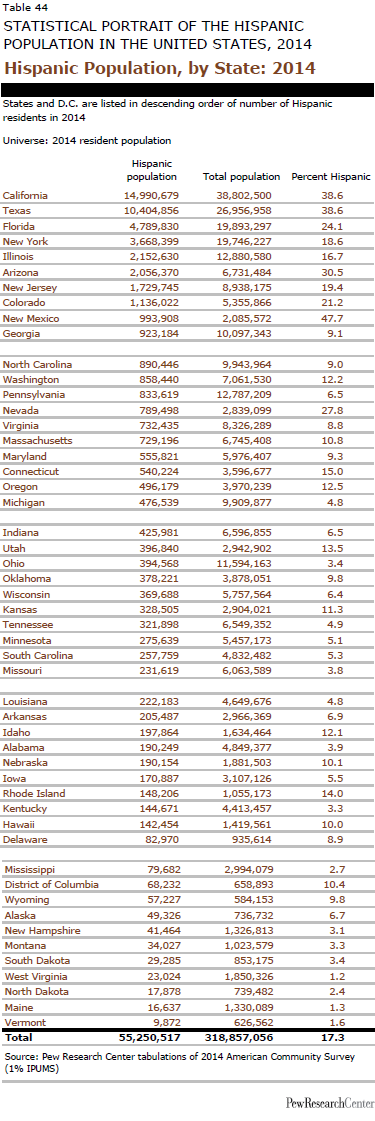
Hispanic Population, by State: 2014
Distribution of Hispanics Across States: 2014

Back to top

Icon for promotion number 1

Sign up for our weekly newsletter

Fresh data delivered Saturday mornings