Just over half of adult Americans consider themselves middle class. They are a varied lot.
Asked to place themselves into one of five socioeconomic categories, just over half (53%) of adults in our survey describe themselves as middle class, a finding that has varied very little over many decades of social science survey research.3 On most key components of social and economic status — such as income, wealth, health, education, homeownership — the survey finds the self-defined middle class is truly in the middle, positioned between those who identify with the classes above and below them. But even within this self-defined middle class, there are notable economic and demographic differences. For example, younger adults and older adults are both more likely than middle-aged adults to describe themselves as middle class, even though their income levels are lower. Meantime, middle-aged middle class adults are more likely than those who are younger and older to report financial stresses, even though they have more income. Also, roughly the same percentages of whites (53%), blacks (50%) and Hispanics (54%) self-identify as middle class, despite the fact that the income and wealth of blacks and Hispanics who say they are middle class is much lower than that of whites who say they are middle class.
Middle class Americans – and all Americans – feel less progress in their lives now than at any time in at least 44 years.
On a scale of zero to ten, survey respondents were asked to give a numerical rating to their present quality of life, then to use the same scale to rate the life they led five years ago and finally to rate the life they expect to lead five years from now. More than half rate their life today either worse (31%) than their life five years ago or the same (25%). Just 41% say their life today is better. In the 44 years that these “ladder of life” questions have been asked in Pew and Gallup surveys, these are the most bearish ratings ever recorded. Not surprisingly, there is a class-based pattern to the public’s judgments. The self-defined lower classes are the most discouraged about their recent progress (44% rate their life today below their life five years ago); the self-defined upper classes are the least discouraged (just 22% rate their life today below their life five years ago); while the self-defined middle class is situated between the two groups, but closer to the top than the bottom (28% rate their life today below their life five years ago).
Most people in the middle class feel they’ve exceeded their parents’ standard of living.

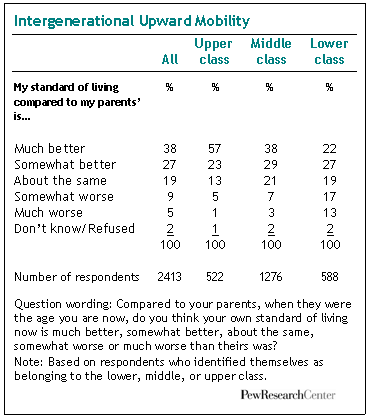
When the middle class lengthens its time horizons, it elevates its assessment of personal progress. Two-thirds (67%) say their standard of living is better than the one their parents had at the age they are now. Just 10% say their standard of living is worse. In these judgments, the middle class is less upbeat than those in the upper classes (80% of whom say they’re doing better than their parents) and more upbeat than those in the lower classes (49% of whom say they’re doing better than their parents). Many of these differences between the classes wash away when people are asked about their expectations for the next generation. Roughly half of respondents in all three classes say they expect their children’s standard of living to exceed their own. However, a significantly larger share of those in thelower class (31%) than of those in the upper (17%) or middle (19%) classes say they think their children’s lives will be worse than theirs. A greater share in the latter two groups say that they expect their children to do about the same in life as they themselves have done.
The vast majority of middle class adults say it has become harder to maintain a middle class lifestyle. But most of them think they themselves are beating the odds.
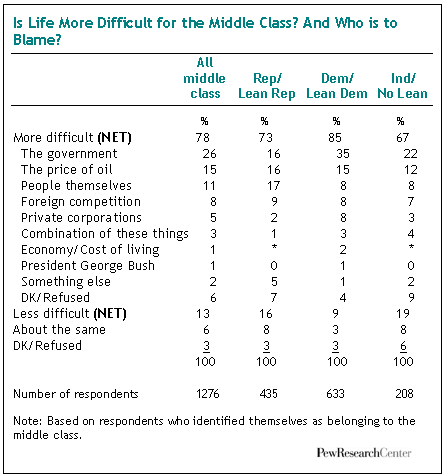
Just 28% of middle class respondents say they’ve fallen backward in life in the past five years. But a lopsided majority (78%) says it has become more difficult over the past five years for people who are middle class to maintain their standard of living. These responses suggest that most middle class adults think of themselves as at least holding their own against daunting odds. The widespread perception that it is harder now than it was five years ago to maintain a middle class standard of living is not class-based. Large majorities of all three classes (72% upper; 78% middle; 89% lower) share this view.
There is nothing approaching a consensus about who or what is responsible for the middle class squeeze.
Nearly everyone agrees that it’s become harder to maintain a middle class lifestyle, but there’s no consensus about who or what is mostly to blame. Among middle class respondents, about a quarter (26%) blame the government, 15% blame the price of oil, 11% blame the people themselves, 8% blame foreign competition, 5% blame private corporations and the rest cite other factors or do not have an answer. Within the middle class, big differences on this question occur along partisan lines. Democrats are most likely to point the finger at government (35% do so) while Republicans divide blame among the people (17%), the government (16%) and the price of oil (16%).There are also class divisions on this question, with the lower class nearly twice as likely as the upper class to blame the government (39% versus 21%).

Within the middle class, there’s a wide range of financial circumstances and anxieties.
Fully four-in-ten Americans with family incomes below $20,000 say they are middle class, as do a third of those with incomes of $150,000 or more. Not surprisingly– given this broad range– some in the middle class (39%) report that they are financially comfortable, while 37% say they “have a little left over after meeting expenses” and 20% say they “just meet expenses.” Only 3% say they can’t meet expenses. Asked about their financial experiences in the past year, more than half of middle class adults report that they’ve had to tighten their belts. Half also expect that they will have to cut more spending in the year ahead. Among those in the middle class who are employed, about a quarter (25%) worry that they could be laid off, that their job could be outsourced, or that their employer could relocate in the coming year, and a bit more (26%) worry that they could suffer a cutback in salary or health benefits.
Keeping up with the Joneses: Americans have a finely calibrated sense of how much money it takes to live a middle class lifestyle in their area. But they tend to overestimate how many people have certain high-end goods and services.

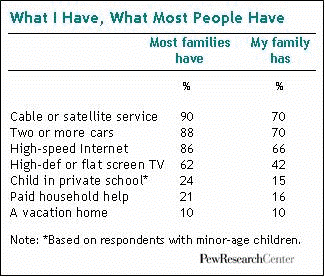
When we asked respondents to estimate how much money it takes for a family of four to live a middle class lifestyle in their community, the median of all responses was $70,000– uncannily close to the Center’s national estimate, based on Census Bureau data, of $68,698 a year for a four-person household.4 However, when we presented respondents with a list of high-end consumer goods and services, and asked whether they have them and whether they believe most other people have them, their tendency in some cases was to over-estimate what most other families have. For example, more than six-in-ten (62%) believe say that most families have a high definition television, whereas just 42% of all adults say that their family has one. Similarly, about a quarter (24%) of respondents believe that most people have a child in private school, though only 15% of parents with school age children report having a child in private school. Lopsided majorities also believe that most families have cable or satellite service, two or more cars, and high speed internet access. In these judgments, they are correct– a majority of families report that they do in fact have these goods and services.
Everything is relative: People’s estimates of the price of admission to a middle class lifestyle rises with their own income levels and with the cost of living in their own communities.
There’s a strong correlation between respondents’ family income and their estimate of what it takes to lead a middle class lifestyle. The greater the income, the higher the estimate. Adults in families whose income is between $100,000 and $150,000 a year believe, on average, that it takes $80,000 to live a middle class life in their area. By contrast, adults in families whose income is less than $30,000 a year believe that a middle class lifestyle can be had for about $50,000 a year. Analyzing these estimates by the ZIP codes of the respondents yields a similar finding: that people who live in communities with a high cost of living think it takes, on average, about $15,000 more to be in the middle class than do people who live in communities with a low cost of living.
Asked to weigh their priorities in life, the middle class puts time ahead of wealth — and everything else.

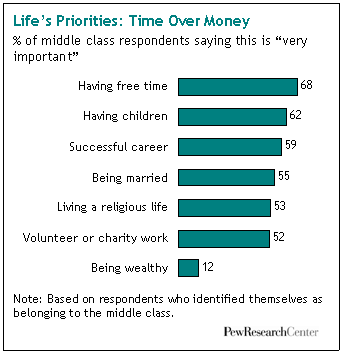
Some two-thirds (68%) of middle class respondents say that “having enough free time to do the things you want” is a very important priority in their lives. That’s more than say the same about any other priority we asked about in this surveyincluding: having children (62% said that is very important), being successful in a career (59%), being married (55%), living a religious life (53%), doing volunteer work/donating to charity (52%); and being wealthy (12%). Upper and lower class respondents give essentially the same answers. The demographic groups most inclined to say they highly value free time are the ones least likely to have it– such as the employed, the middle-aged, and mothers of young children. In recent years, a number of public opinion surveys have documented Americans’ growing sense of feeling rushed, and this perception tracks with the growth in the number of mothers who are employed outside the home and in the number of two-earner couples. However, recent research on whether Americans in fact have less leisure time has produced mixed findings. At least one major report, which relied on five decades of time use logs kept by different groups of survey respondents, found that no matter what most people may perceive, Americans today have more leisure time now than they did several decades ago.5 Other reports find that many middle class families have maintained their lifestyle only by becoming two-earner households, with all the attendant time stresses.6
Most middle class Americans believe that the rich just keep getting richer, but they don’t have a settled view about how the rich become rich.
Two thirds of people in the middle class agree with the proposition that the rich are getting richer and the poor are getting poorer. But they’re split in their explanations about how the rich become rich. Some 47% say it’s mainly the result of having good connections or being born into it, while 42% say it’s mainly the result of hard work, ambition and education. Not surprisingly, those in the upper classes (56%) are more inclined to cite hard work, ambition and education than are those in the middle (42%) or lower (32%) classes. Class divisions also are apparent on a related question about whether success in life is determined by forces outside one’s control. Majorities of all three classes disagree with that proposition, with a greater share of the upper class disagreeing (69%) than of the middle (62%) or lower (51%) classes.


