Most Americans feel stuck in their tracks. A majority of adults in this country say that in the past five years they either haven’t moved ahead in life or have fallen backwards. This is the most downbeat assessment of personal progress in nearly a half century of polling by the Pew Research Center and the Gallup Organization.
People feel this way for a reason. Median annual household income in the United States– arguably the best single measure of a middle class standard of living — is below the peak it reached in 1999, after adjusting for inflation.1 This has been one of the longest slumps for this key indicator in modern U.S. history. And the pain has not been spread evenly. Those in the upper income tier have done better than those in the middle and lower tiers — not just during this decade’s downturn, but through good times and bad stretching back to the early 1970s.
These two trends — a recent decline in standard of living, coming on top of a long-term rise in income inequality — have conspired to produce the economic malaise characterized by candidates and commentators alike during this presidential campaign season as “the middle class squeeze.”
There’s no denying that the phrase strikes a chord with the American public. According to a new Pew Research Center survey, about eight-in-ten (79%) adults say it is more difficult now than it was five years ago for middle class people to maintain their standard of living. Two decades ago, just 65% felt this way, according to a 1986 NBC/Wall Street Journal poll.
Nonetheless, these downbeat appraisals — both of personal progress and of middle class well-being in general — are not the public’s only perspectives on this matter. Despite their short-term sense of stagnation, most Americans see in the sweep of their lives a long arc of progress. Nearly two-thirds (65%) say they have already exceeded the standard of living that their parents had at the age they are now. Most expect to face some belt-tightening— or worse– in the coming year, but a majority is confident that their quality of life in five years will be significantly better than it is now. And, gazing into a more distant future, most expect their children’s standard of living to be better than their own.
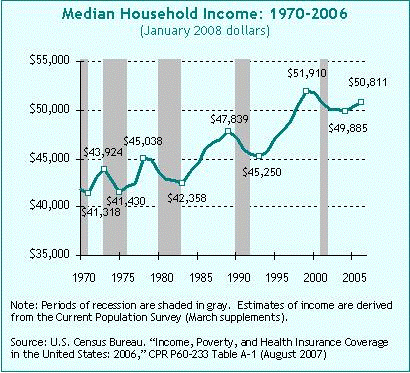
In short, the public is beleaguered but unbowed. And its positive long-term perspective, like its negative short-term assessment, is in line with underlying economic realities. Despite the downturn of the current decade, median household income increased by 41% from 1970 to 2006 (the last year for which such data are available), after adjusting for inflation and changes in household size. To be sure, the rising tide favored some boats over others. The income gains over this period were greater for upper income adults than for middle or low income adults, and the wealth gains were much greater in the top income tiers than in the middle or at the bottom. So for those in the middle peering upward, absolute progress has gone hand in hand with relative decline.
All of these economic trends — stagnation in the short term, rising prosperity and rising inequality in the long term — provide a context for the nuances of public opinion on the subject of the “squeeze.” When survey respondents say they haven’t moved forward in recent years, the economic data say they’re right. When respondents say they’re doing better than their parents, the economic data say they’re right. When respondents say it has become more difficult to maintain a middle class standard of living, the data once again say they’re right — if what they mean is that it has become harder for people in the middle to keep pace with those above them.
Through the Looking Glass of Class
To examine the dynamics of public opinion through the prism of socioeconomic class, the survey asked respondents to place themselves into one of five groups– upper class, upper middle class, middle class, lower middle class and lower class. About half (53%) say they are middle class; some 19% percent say they are upper middle class and another 19% say they are lower middle class; 6% say they are lower class and 2% say they are upper class.2
One overarching finding from this exercise in self-identification is that class divides people far more by their economic experiences and characteristics than it does by their social values and life priorities, their demographic traits or their evaluations of their own quality of life and economic mobility.
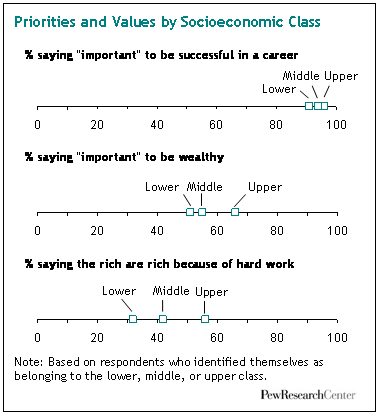
For example, the percentage of people who say they “live comfortably” ranges from 66% of the self-defined upper class to 39% of the self-defined middle class to just 9% of the self-defined lower class. But the range is not nearly as wide when respondents are asked whether they’re doing better in life than their parents; some 80% of the upper class say they are, compared with 67% of the middle class and 49% of the lower class. And the class disparities grow smaller on questions about life priorities. For example, 66% in the upper class say it is important to be wealthy, compared with 55% in the middle class and 51% in the lower class. On the demographic front, class disparities are fairly wide with regard to education and less wide with regard to homeownership and marriage.
On virtually every topic explored in this survey, responses of the middle class fall between those of the upper and lower classes– but sometimes the middle leans toward the bottom, and sometimes toward the top. This report will examine the attitudes, aspirations and anxieties of America’s middle class in detail– and it will also explore the economic and demographic realities that underlie them. It will focus on changes in the middle class since 1970; on differences among the middle, lower and upper income groups; and on the wide range of experiences, opinions and values within the middle class itself.
Before summarizing our findings, a note about terminology. Throughout the report, when we refer to the “middle class” we are describing the 53% of adults who identified themselves that way in response to a question in our survey. When we refer to those who are “middle income,” we are describing the 35% of adults who live in a household where the annual income falls within 75% to 150% of the national median (a standard yardstick in economic literature about income dispersion). The disparity in the size of these two “middles” underscores one of the themes of this report: that being middle class is a state of mind as well as a statement of income and wealth.