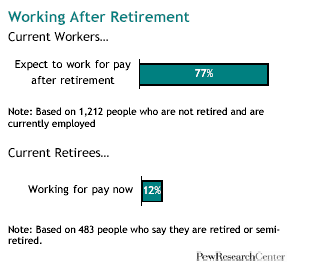
More than three quarters of today’s workers (77%) expect to work for pay even after they retire, according to a new Pew Research Center survey. Of those who feel this way, most say it’s because they’ll want to, not because they’ll have to.
But whatever the motivation, these expectations are dramatically out of step with the experiences of people who are already retired – just 12% of whom are currently working for pay (either part or full time), according to the Pew survey, and just 27% of whom have ever worked for pay while in retirement, according to a survey this year by another research organization.1
Along these same lines, there is also a disparity between the age at which today’s workers say they plan to retire and the age at which today’s retirees actually did retire.
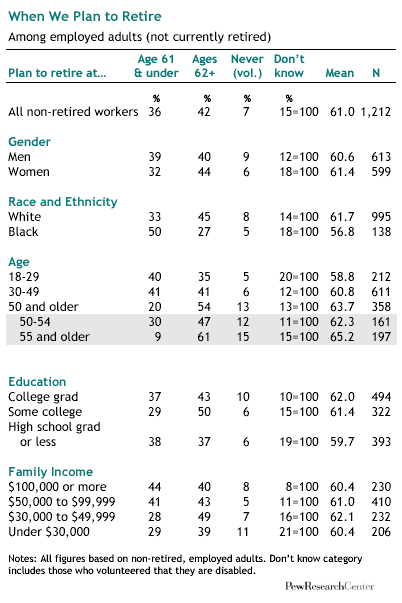
The average worker expects to retire at age 61, according to the Pew survey, while the average retiree actually retired at 57.8. These numbers have both crept upward since the mid-1990’s; in the decades before that, the age at which people expected to retire had been falling, as had the labor force participation rates of older men.2
The latest Pew findings suggest that retirement is a phase of life about which public attitudes, expectations and experiences are in a period of transition. And given the demographic changes afoot (the share of adults ages 65 and older is expected to grow from 12% of the U.S. population in 2000 to 21% in 20503) as well as the changes underway in the basic financial framework of retirement (fewer people now than in the past work for employers who provide defined benefit pension plans) this evolution in attitudes is likely to continue for years to come.
The Pew telephone survey was taken from June 20 through July 16 among a nationally representative sample of 2,003 adults. It has a margin of error of plus or minus 2.5 percentage points.
Working After Retirement: Expectations and Reality Are Out of Sync
Among the 77% of the currently employed (and not retired) public who say they expect to do some kind of work for pay after they retire, there are no significant differences by age, income, gender, race, ethnicity, education or region. In short, this has now become a widely-held expectation among virtually all kinds of people.
It doesn’t matter if a person is self-employed or not; if a person works for a big organization or a small one; if a person derives a strong sense of identity from work or not; all are equally likely to say they expect to work for pay after they retire.
There is a small difference on this question by the type of work people do. Some 79% of white collar workers say they expect to do some kind of work for pay after they retire, while just 73% of blue collar workers say this. Also, people who work in a school setting are a bit more inclined (85%) than others to say they expect to do some sort of work for pay after they retire.
The expectations that today’s workers have about working after retirement are sharply different from the actual experiences of today’s retirees.
The Pew survey finds that just 12% percent of people who are currently retired report that they are currently working, either full-time (5%) or part-time (7%). Also, a survey taken earlier this year by the Employee Benefit Research Institute found that just 27% of today’s retirees report that they have ever worked for pay after retirement.

Retired men are more likely than retired women to report working; 16% of men are doing so compared with 7% of women. Retirees who have graduated from college are also more likely to be working for pay (20%) than are those who have less education (9%).
Working After Retirement: Have to or Want to?
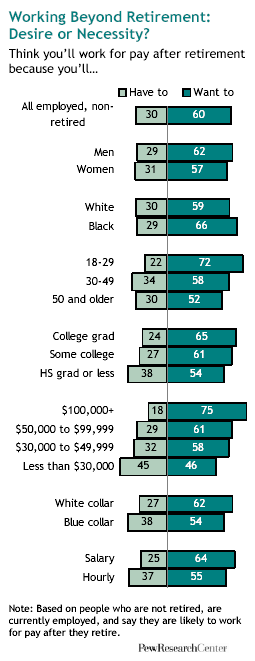
By a two-to-one margin, those who expect to work after retirement say they will do so mostly because they’ll want to rather than because they’ll have to.
Not surprisingly, there are some significant differences in expectations on this question according to how much money people earn and the kind of work they do.
Those with more education and more income are the most likely to say they’ll work after retirement because they want to, not because they have to. Also, younger workers (ages 18 to 29) and the self-employed are more likely than others to say they’ll work after retirement out of desire rather than necessity.
On the other side of the coin, parents of minor age children are more likely than others to say they expect to work after retirement because they’ll need to, not because they’ll want to. Blue collar workers are also more likely to say this, as are hourly workers of all kinds.
But other than that, there are no significant differences on this question by gender, race, marital status or region of the country.
Working After Retirement: Who’s Thought About It?
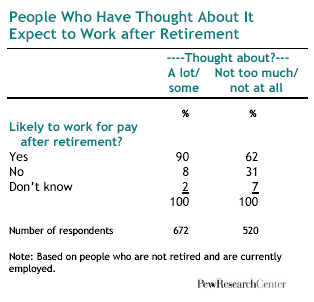
Older adults are more likely to report having given either some or a lot of thought to the question of whether they’ll work after retirement. Fully 66% of non-retirees ages 50 and older report giving this question a lot or some thought; 53% of those ages 30 to 49 and 39% of those ages 18 to 29 have done the same.

Regardless of their current age, those who have thought about whether or not they will work after retirement are much more likely than those who haven’t thought about it as much to say they will work after retirement. Among those who have thought about this issue at least some, nine-in-ten say they are likely to work for pay after retirement. Among those who have given less thought to this issue, 62% think they are likely to work for pay after retirement.
Age of Retirement: Expectations and Reality
Workers plan to retire, on average, at age 61. Not surprisingly, older workers say their retirement will be later in life than do younger workers.

For example, the anticipated retirement age among those ages 50 and older is an average of 63.7 compared with 58.8 among those currently ages 18 to 29.
Working men are a bit more likely than working women, on average, to plan an early retirement; 39% of working men plan to retire at or before reaching age 61 compared with 32% among working women. Working women are less likely to name a specific age for retirement, however; among all those who name a planned retirement age, the average anticipated age of retirement is about the same for men and women.
Not surprisingly, workers with higher family incomes are more likely to say they will retire on the early side; 44% of those with incomes of $100,000 or more say they will retire at or before reaching age 61. The comparable figure for those with incomes under $30,000 is 29%. Less affluent workers are less likely than those with more affluence to name a specific age for planned retirement; among those who name a planned retirement age, the mean differences across income groups are modest.
There are modest differences in anticipated retirement age among education groups. Those with less education anticipate an earlier retirement age, on average, than do those with more education. Whites foresee a longer working life than do blacks. Half of all black workers plan to retire on or before reaching age 61; a third of white workers say the same. The mean age for anticipated retirement is 56.8 among blacks and 61.7 among white workers. The pattern among Hispanics is similar to that of blacks but there are too few Hispanic workers in the sample for reliable analysis.
About this Survey
Results for this survey are based on telephone interviews conducted with a nationally representative sample of adults, ages 18 years and older, living in continental U.S. telephone households.
- Interviews conducted Oct. 18 – Nov. 9, 2006
- 2,000 interviews, including 1,500 homeowners
- Margin of sampling error is plus or minus 2.5 percentage points for results based on the total sample at the 95% confidence level. The margin of sampling error is higher for results based on subgroups of respondents.
Survey interviews conducted under the direction of Princeton Survey Research Associates International. Interviews were conducted in English and Spanish.
Bear in mind that question wording and practical difficulties in conducting surveys can introduce error or bias in the findings of opinion polls.
Read the full report for more details.


