
Later this week, the Group of Seven (G7) will meet in Canada for their annual summit. Canadian Prime Minister Mark Carney will host the leaders of the other member countries: France, Germany, Italy, Japan, the United Kingdom and the United States.
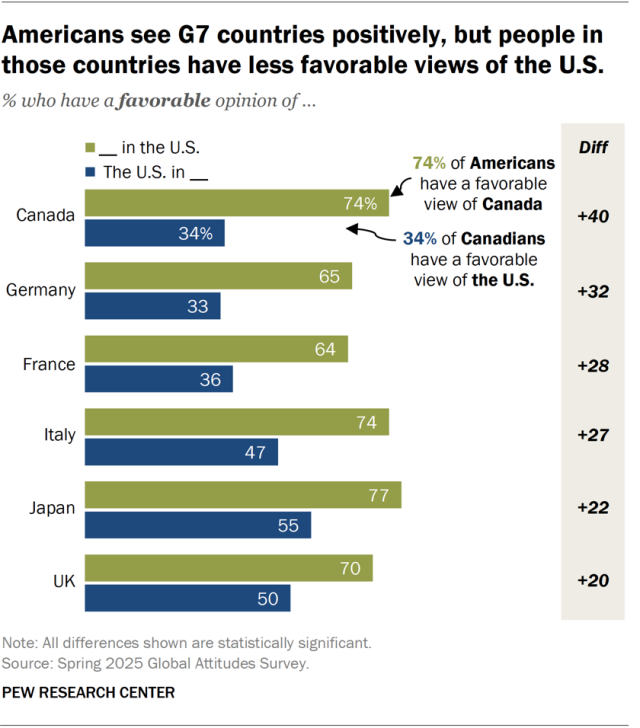
Americans have more favorable views of the other G7 countries than people in these countries do of the U.S., according to Pew Research Center surveys conducted this spring.
For example, 65% of Americans have a very or somewhat favorable opinion of Germany. But 33% of Germans say the same about the United States.
Overall, majorities of Americans see the other G7 countries favorably, including at least seven-in-ten who say this about Japan (77%), Canada (74%), Italy (74%) and the UK (70%). But views of the U.S. in G7 countries are mixed or negative. Views are most favorable in Japan, where 55% think positively of the U.S.
For more on international attitudes toward the U.S., read “America’s Image Declines in Many Nations Amid Low Confidence in Trump”
Since spring 2024, favorable views of the U.S. have decreased significantly across all G7 countries except for the UK. Last year, about half or more in every G7 country except for France had a very or somewhat favorable view of the U.S. Those numbers are now closer to what they were in summer 2020, in our final survey of these countries during Trump’s first term.
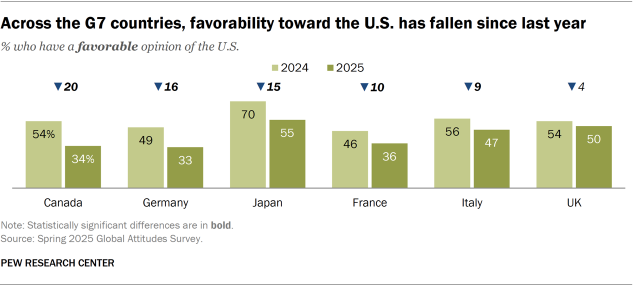
The largest decrease in favorability toward the U.S. among G7 countries is in Canada. About a third of Canadians (34%) think positively of their southern neighbor today, compared with 54% last year. Meanwhile, 64% of Canadians now have unfavorable views of the U.S., including 39% whose views are very unfavorable. Last year, 15% of Canadians viewed the U.S. very unfavorably.
There are also significant decreases in U.S. favorability in Germany and France. By contrast, Americans’ views of Germany and France have not changed significantly since 2024.
Views by ideology
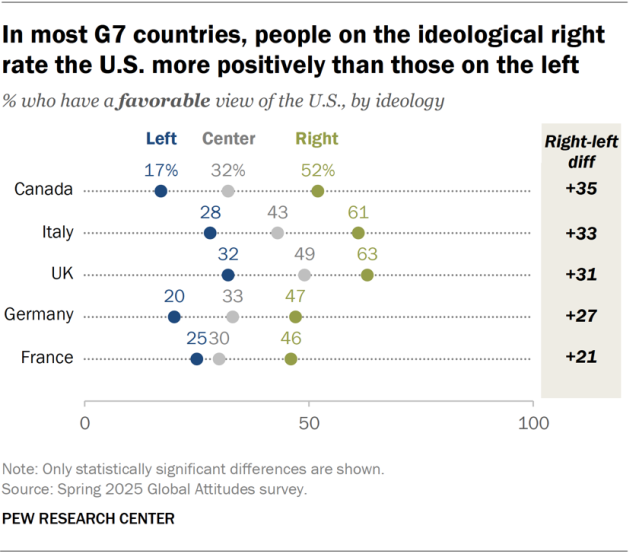
In Canada, France, Germany, Italy and the UK, views of the U.S. are much more favorable among those on the ideological right than those on the left.
The biggest difference is in Canada: 52% of Canadians on the right have a favorable view of the U.S., compared with 17% of those on the left. Similarly, the share of Italians on the right who feel positively toward the U.S. is about double the share of Italians on the left who feel this way (61% vs. 28%).
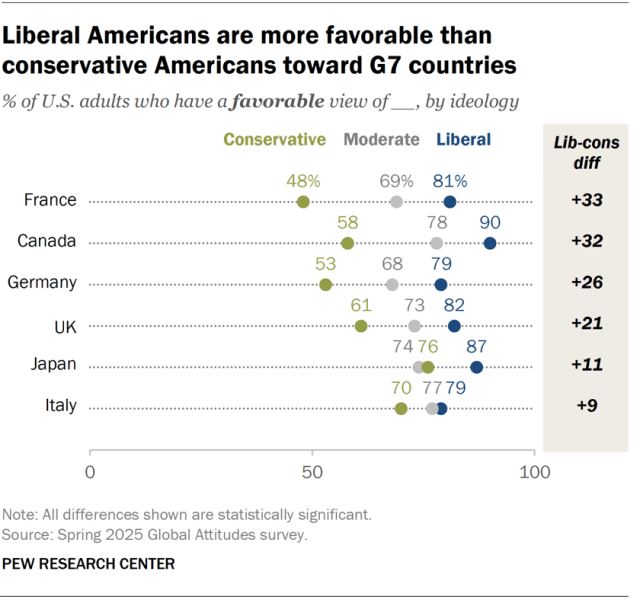
In the U.S., the opposite is true – liberal Americans have more favorable views of all other G7 member countries than conservatives do. And they are much more likely than conservatives to think positively of France (+33 percentage points), Canada (+32) and Germany (+26).
Note: Here are the questions used for this analysis, along with responses, and its methodology.

