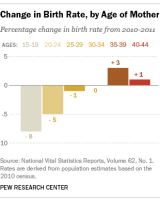
The demographic profile of women who give birth in the United States is changing. This is due in part to shifting immigration patterns, but also to notable changes in birth rates among some groups, according to a Pew Research Center analysis of newly released data from the National Center for Health Statistics.
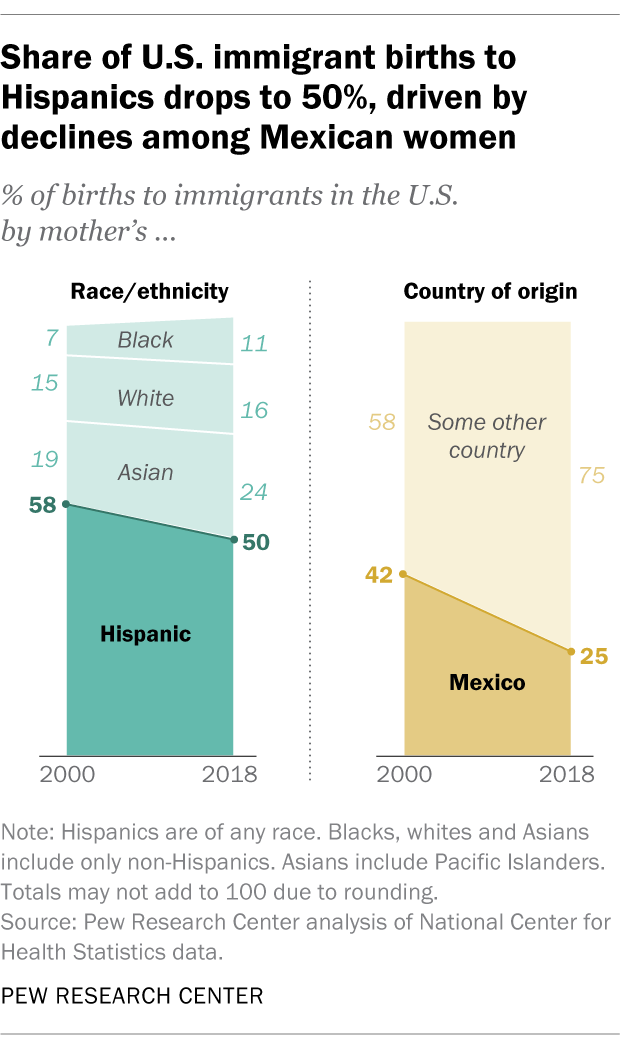
Among immigrant women, half of all births in 2018 were to women of Hispanic origin, down from 58% in 2000. At the same time, births to Asian women accounted for about one-in-four immigrant births last year (24%), up from 19% in 2000. The share of immigrant births to black women also rose during this span, from 7% to 11%.
Much of the downturn in the share of immigrant births to Hispanics has been driven by a decline in births among Mexican-origin women. A quarter of immigrant births in the U.S. were to women of Mexican origin in 2018, compared with 42% in 2000. Not since the 1970s has the share of births to women born in Mexico dipped below 30% of all U.S. immigrant births.
While the share of immigrant births to Hispanic women has declined, Hispanics account for a growing share of births among U.S.-born women. In 2018, 17% of births to the U.S. born were to women of Hispanic origin, up from 10% in 2000. This growth was driven primarily by the rapid expansion of the U.S.-born Hispanic population as a whole: The number of Hispanic women ages 15 to 44 has more than doubled since 2000, for instance.
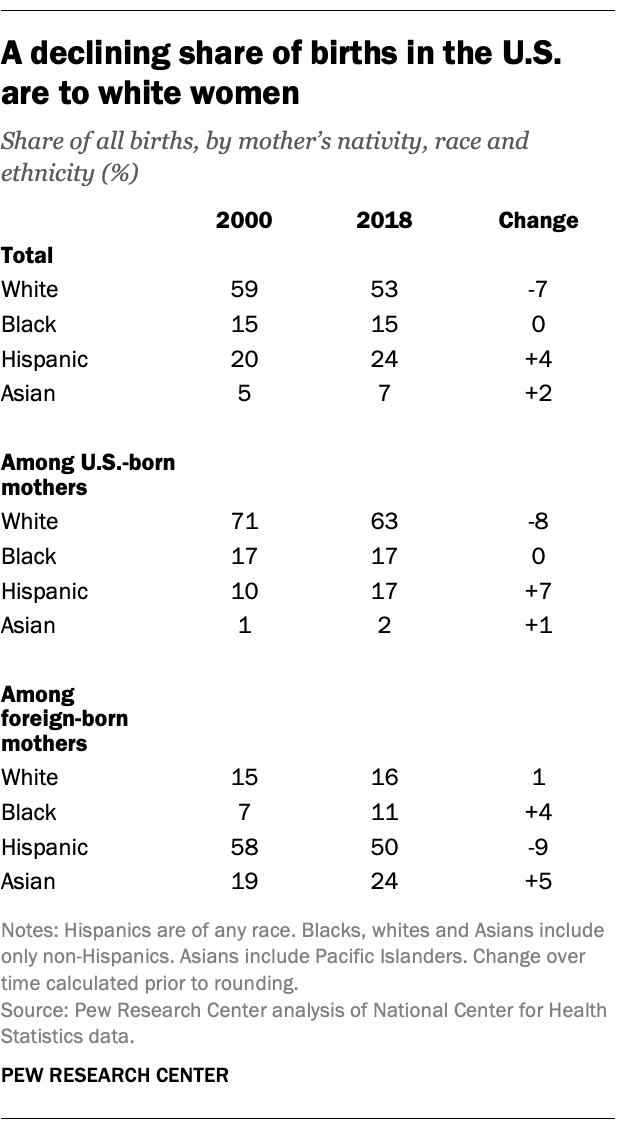
At the same time, there has been a decline in the number and share of white women among U.S.-born women of childbearing age. Partly as a result, the share of births to U.S.-born white women fell from 71% in 2000 to 64% in 2018.
Looking at all births in the U.S. last year – both to U.S.-born and foreign-born women – just over half (53%) were to white women, down from 59% in 2000. The share of births to Hispanic women ticked up to 24% from 20%. Meanwhile, 15% of births were to black women and 7% were to Asian women, mostly unchanged from 2000.
Shifts in immigration streams and birth rates
The declining share of immigrant births to Hispanic women is due in part to declines in immigration from Latin America, especially Mexico.
While Latin America was the primary origin region of U.S. immigrants for many years, that has changed. Since 2010, the primary origin region has been Asia, which helps explain the growing share of immigrant births to Asian women. At the same time, growing immigration from Africa and parts of the Caribbean has led to an increase in black immigrants, which in turn has fueled almost all of the rise in births for this group.
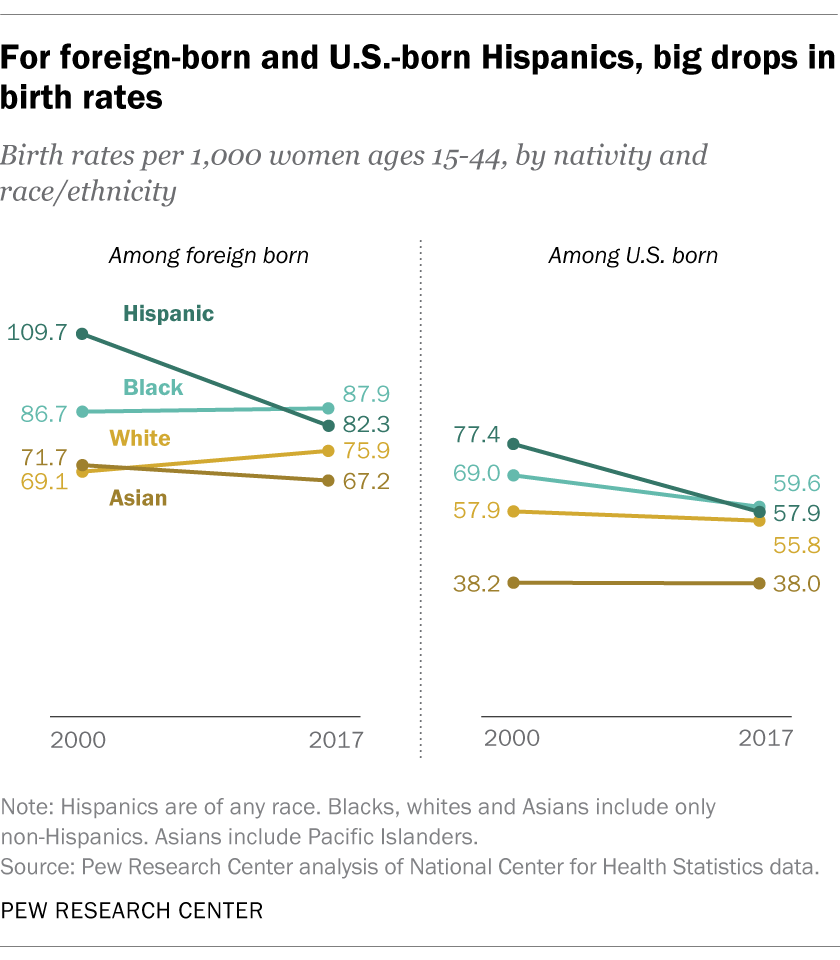
But the declining share of Hispanic immigrants in the U.S. is only part of the story. Foreign-born Hispanic women have experienced particularly dramatic birth rate declines in recent years, too. Since 2000, the number of births per 1,000 Hispanic immigrant women of childbearing age fell 25% – from 109.7 births to 82.3 in 2017 (the most recent year for which data is available). The birth rate of Hispanic immigrant women, which used to be far higher than the rates of all other non-Hispanic immigrant groups, is now lower than that of white immigrant women, though it remains higher than those of black and Asian immigrants.
A key factor driving down U.S. birth rates among Hispanic immigrant women has been the 37% decline in rates among women born in Mexico, from 131.8 in 2000 to 83.0 in 2017. The birth rate among Asian immigrant women declined much more modestly during the same period, from 71.7 to 67.2 births per 1,000 women, while rates for white and black immigrant women ticked up.
Like their foreign-born counterparts, U.S.-born Hispanic women have seen dramatic declines in birth rates. In 2000, there were 77.4 annual births per 1,000 U.S.-born Hispanic women of childbearing age; by 2017, that rate had dropped 25% to 57.9. During the same period, U.S.-born black women experienced a 14% decline in birth rates, while declines were minimal among other groups.
Birth rates remain highest among foreign-born women
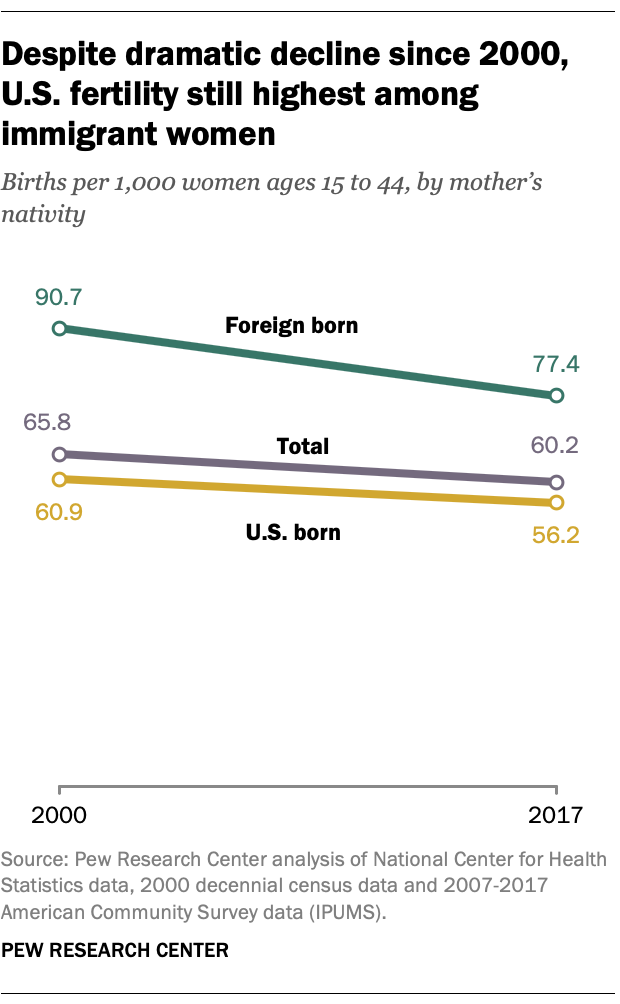
The overall U.S. birth rate has declined 9% since 2000, to a record low of 60.2 births per 1,000 women ages 15 to 44 in 2017. The birth rate hit a short-term peak of 69.3 in 2007 and has declined almost continuously since then.
While the birth rate has declined among both U.S.-born and foreign-born women, immigrant women saw the biggest decline, from 90.7 births per 1,000 women in 2000 down to 77.4 in 2017. Among U.S.-born women, the birth rate dropped from 60.9 to 56.2. Still, immigrant fertility remains far higher than that of the U.S. born – as has long been the case.
The relatively high fertility of immigrant women means that they continue to account for a disproportionate share of U.S. births. While 14% of the U.S. population in 2017 was foreign born, 23% of all births were to immigrant women.
This analysis is primarily based on National Center for Health Statistics (NCHS) data on births in the U.S. to resident women, which are extracted from completed birth certificates.
The denominators used for birth rate calculations, which include all women ages 15 to 44, are derived from the American Community Survey via IPUMS-USA. These rate calculations may differ slightly from those in NCHS publications because NCHS typically uses a denominator based on census population estimates.
Women who were born in U.S. territories, including Puerto Rico, are classified as “foreign born.” While individuals born in Puerto Rico and other U.S. territories are U.S. citizens by birth, the convention of categorizing persons living in the U.S. who were born in U.S. territories as foreign-born has been used by both the United Nations and by NCHS in its online VitalStats data tabulator. Births to women who identify as American Indian or Alaska Native are not broken out separately in the analysis but are reflected in the totals.
