Views on abortion, 1995-2026
Most U.S. adults continue to express support for legal abortion. Currently, 60% say abortion should be legal in all or most cases, while 38% say it should be illegal in all or most cases.

| Year | Legal in all/most cases | Illegal in all/most cases |
|---|---|---|
| 1995 | 60% | 38% |
| 1996 | 57% | 40% |
| 1997 | — | — |
| 1998 | 54% | 42% |
| 1999 | 56% | 42% |
| 2000 | 53% | 43% |
| 2001 | 54% | 43% |
| 2002 | — | — |
| 2003 | 57% | 42% |
| 2004 | 55% | 43% |
| 2005 | 57% | 41% |
| 2006 | 51% | 43% |
| 2007 | 52% | 42% |
| 2008 | 54% | 40% |
| 2009 | 47% | 44% |
| 2010 | 50% | 44% |
| 2011 | 53% | 42% |
| 2012 | 54% | 39% |
| 2013 | 54% | 40% |
| 2014 | 55% | 40% |
| 2015 | 51% | 43% |
| 2016 | 57% | 39% |
| 2017 | 57% | 40% |
| 2018 | 58% | 37% |
| 2019 | 61% | 38% |
| 2020 | 60% | 38% |
| 2021 | 59% | 39% |
| March/April 2022 | 61% | 37% |
| June/July 2022 | 62% | 36% |
| 2023 | 62% | 36% |
| 2024 | 63% | 36% |
| 2025 | — | — |
| 2026 | 60% | 38% |
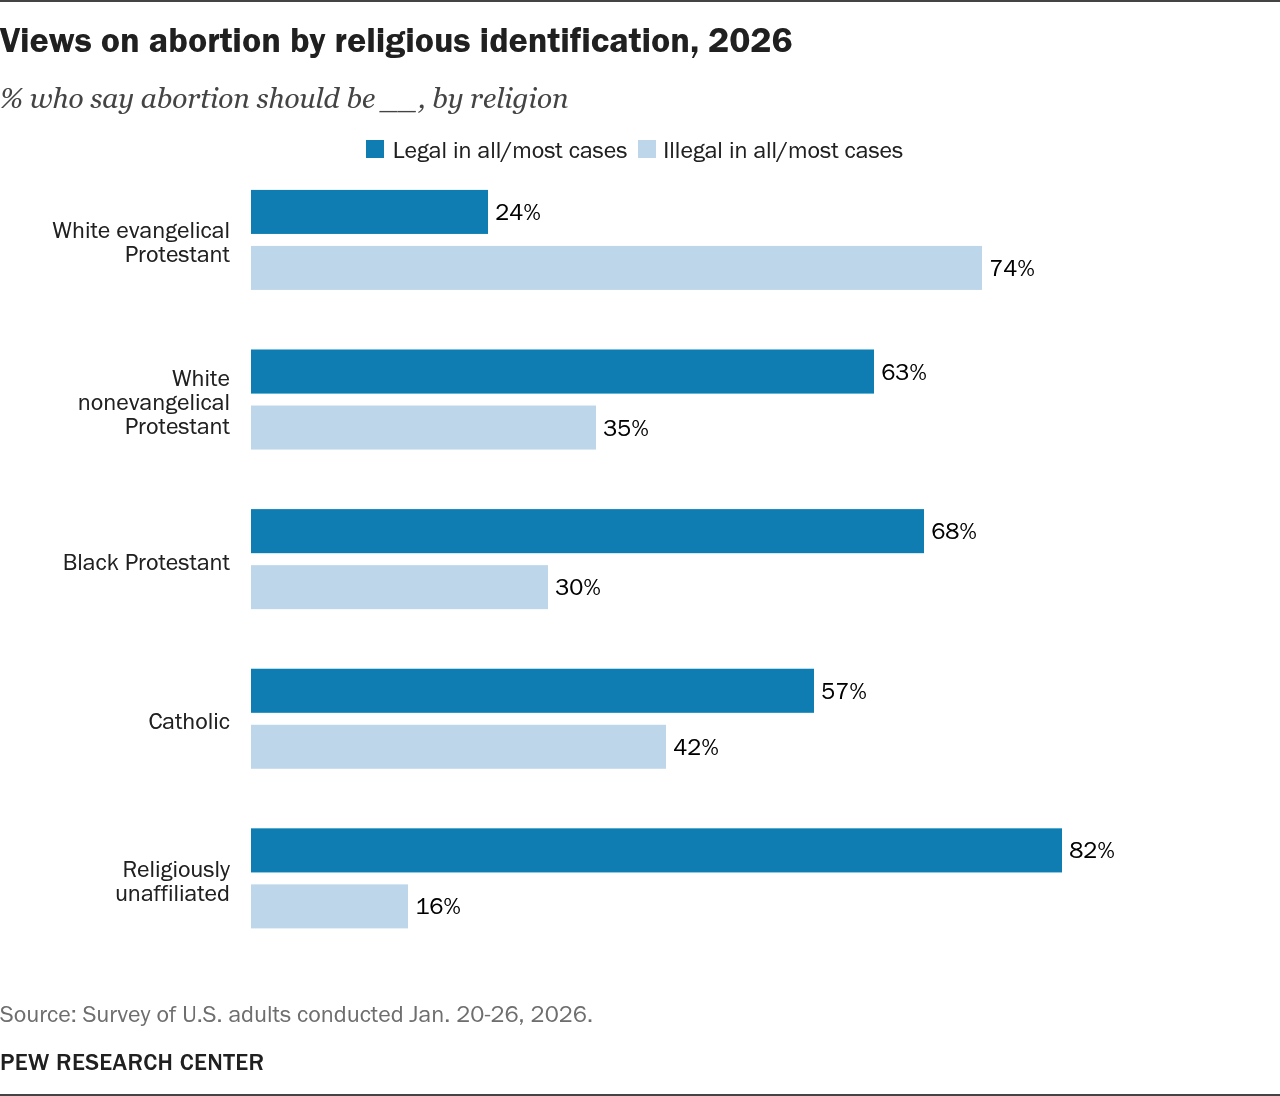
Views on abortion by religious affiliation, 2026
About three-quarters of White evangelical Protestants (74%) think abortion should be illegal in all or most cases. By contrast, 82% of religiously unaffiliated Americans say abortion should be legal in all or most cases, as do 68% of Black Protestants, 63% of White nonevangelical Protestants and 57% of Catholics.
| Religious affiliation | Legal in all/most cases | Illegal in all/most cases |
|---|---|---|
| White evangelical Protestant | 24% | 74% |
| White nonevangelical Protestant | 63% | 35% |
| Black Protestant | 68% | 30% |
| Catholic | 57% | 42% |
| Religiously unaffiliated | 82% | 16% |
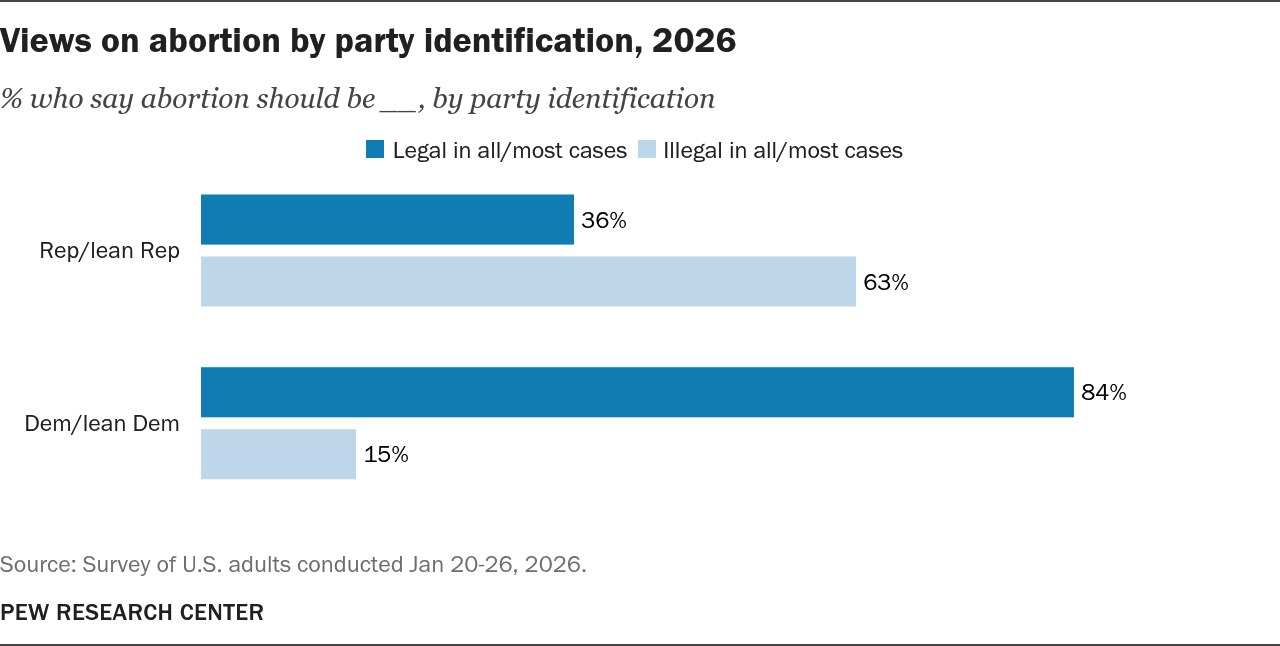
Views on abortion by party identification, 2026
Among Republicans and independents who lean toward the Republican Party, 63% say abortion should be illegal in all or most cases. By contrast, 84% of Democrats and Democratic leaners say abortion should be legal in all or most cases.
| Party identification | Legal in all/most cases | Illegal in all/most cases |
|---|---|---|
| Rep/lean Rep | 36% | 63% |
| Dem/lean Dem | 84% | 15% |
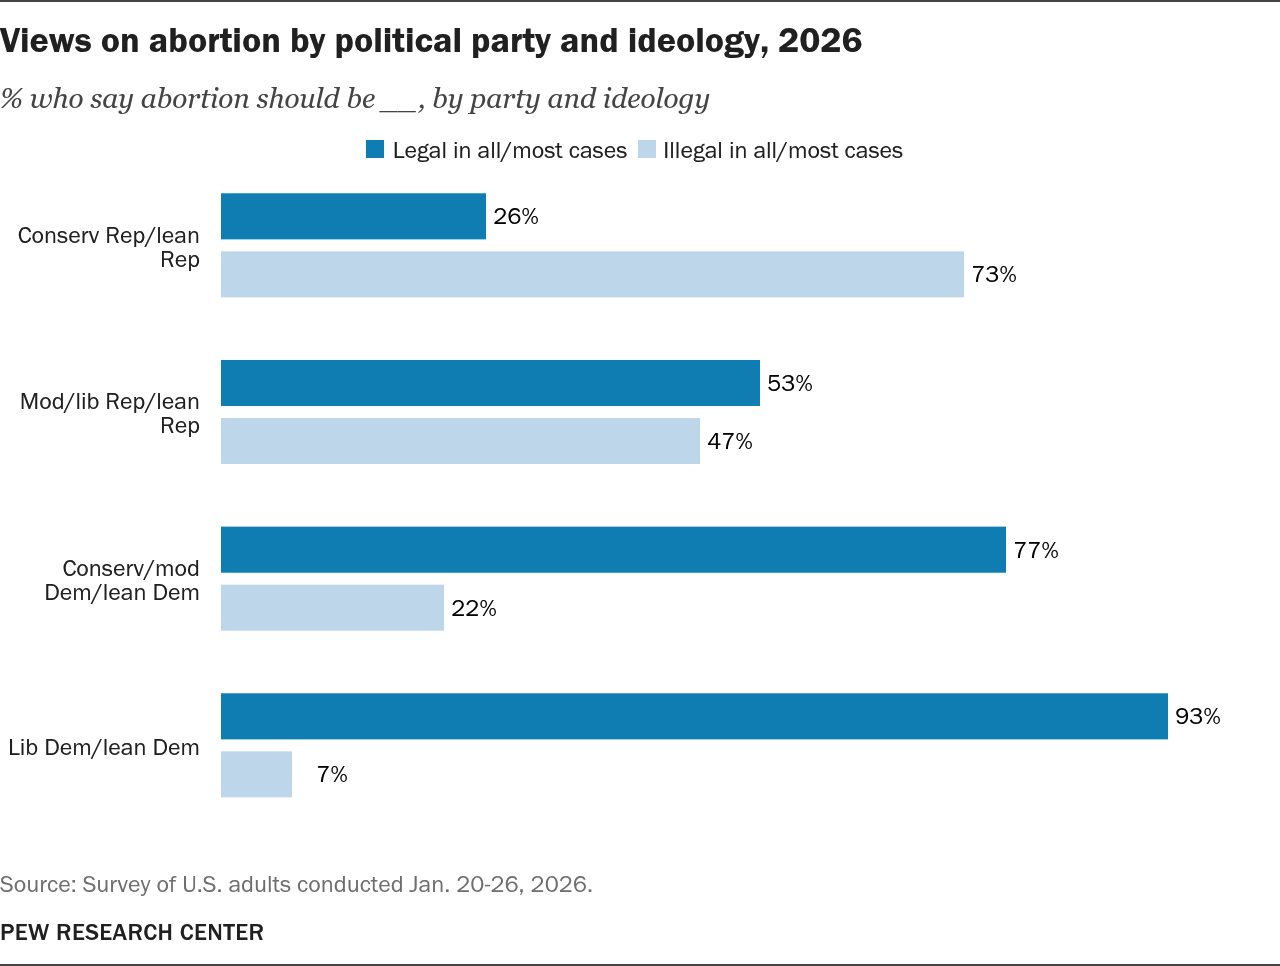
Views on abortion by political party and ideology, 2026
Conservative Republicans and Republican leaners are far more likely to say abortion should be illegal in all or most cases (73%) than to say that it should be legal (26%). Among moderate and liberal Republicans, 53% say abortion should be legal, while 47% say it should be illegal.
The vast majority of liberal Democrats and Democratic leaners (93%) support legal abortion, as do about three-quarters of conservative and moderate Democrats (77%).
| Political party and ideology | Legal in all/most cases | Illegal in all/most cases |
|---|---|---|
| Conserv Rep/lean Rep | 26% | 73% |
| Mod/lib Rep/lean Rep | 53% | 47% |
| Conserv/mod Dem/lean Dem | 77% | 22% |
| Lib Dem/lean Dem | 93% | 7% |
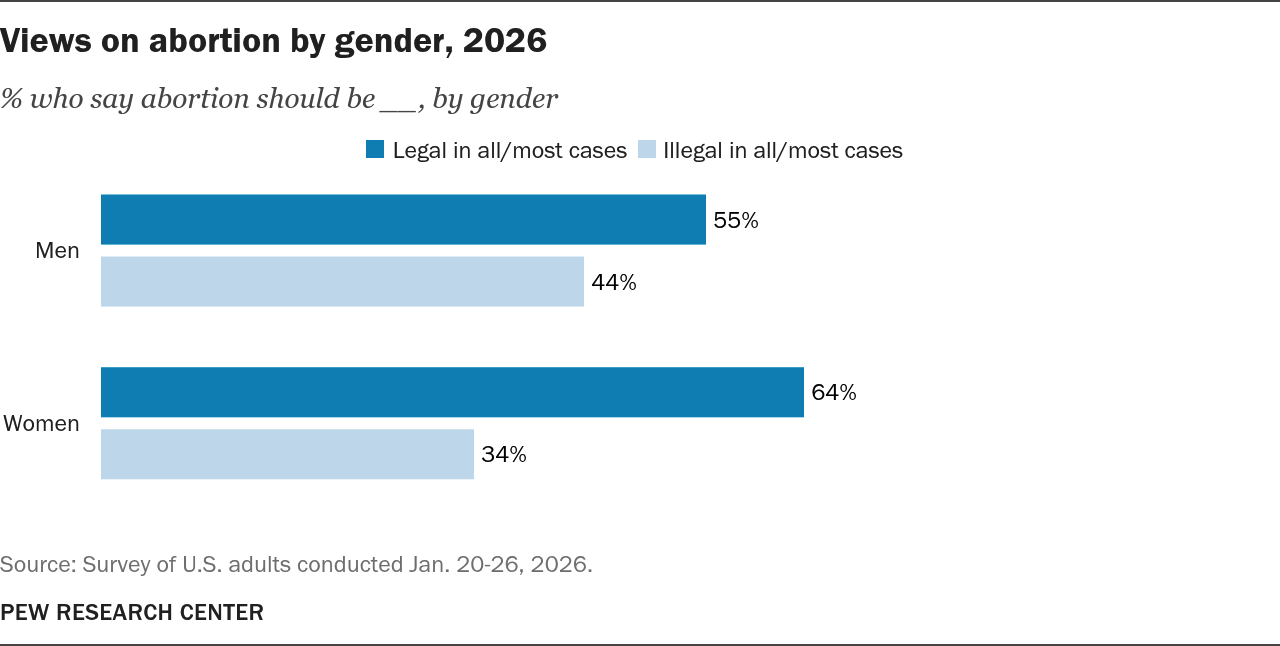
Views on abortion by gender, 2026
Upward of six-in-ten women (64%) and 55% of men say abortion should be legal in all or most cases.
| Gender | Legal in all/most cases | Illegal in all/most cases |
|---|---|---|
| Men | 55% | 44% |
| Women | 64% | 34% |
Views on abortion by race and ethnicity, 2026
Majorities of adults across racial and ethnic groups express support for legal abortion. About seven-in-ten Asian (73%) and Black (71%) adults say abortion should be legal in all or most cases, as do 58% of White adults and 56% of Hispanic adults.
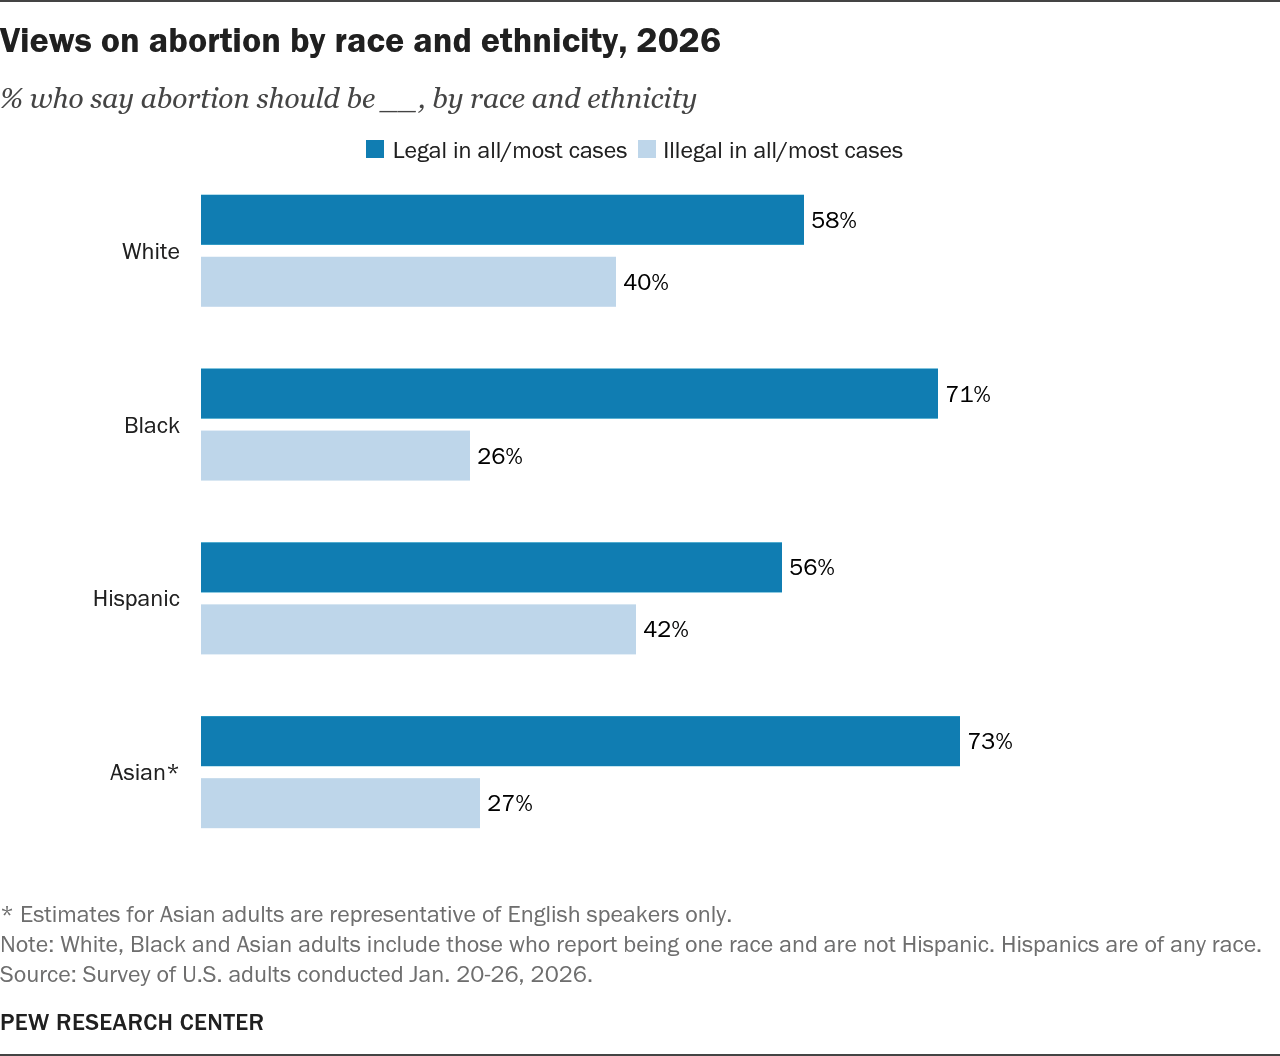
Note: White, Black and Asian adults include those who report being one race and are not Hispanic. Hispanics are of any race.
| Race and ethnicity | Legal in all/most cases | Illegal in all/most cases |
|---|---|---|
| White | 58% | 40% |
| Black | 71% | 26% |
| Hispanic | 56% | 42% |
| Asian* | 73% | 27% |
Note: White, Black and Asian adults include those who report being one race and are not Hispanic. Hispanics are of any race.
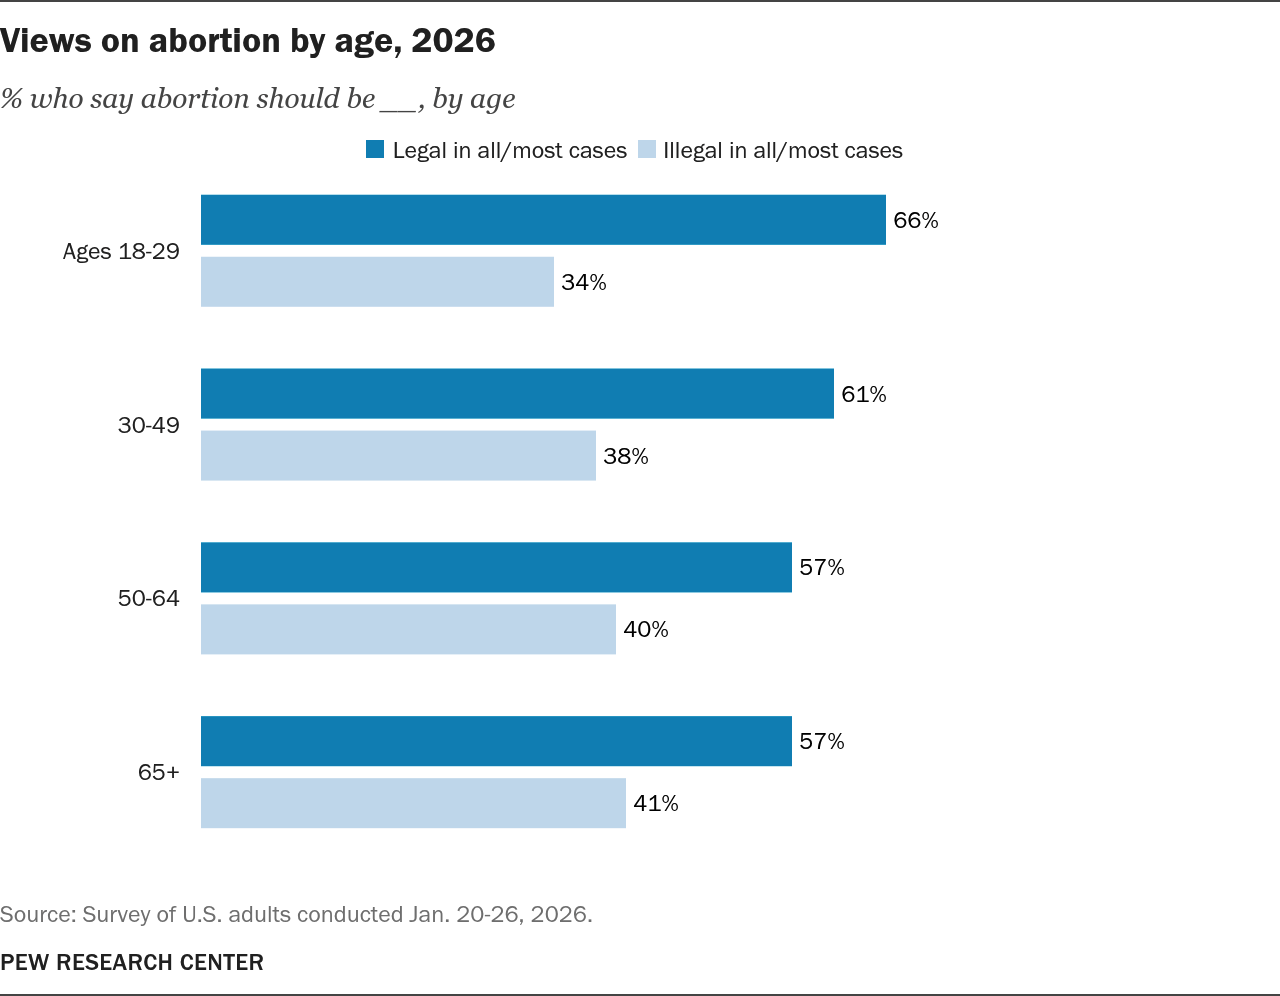
Views on abortion by age, 2026
Among adults under 30, 66% say abortion should be legal in all or most cases, as do 61% of adults ages 30 to 49. Among those 50 to 64, 57% express support for legal abortion, as do 57% of those 65 and older.
| Age | Legal in all/most cases | Illegal in all/most cases |
|---|---|---|
| Ages 18-29 | 66% | 34% |
| 30-49 | 61% | 38% |
| 50-64 | 57% | 40% |
| 65+ | 57% | 41% |
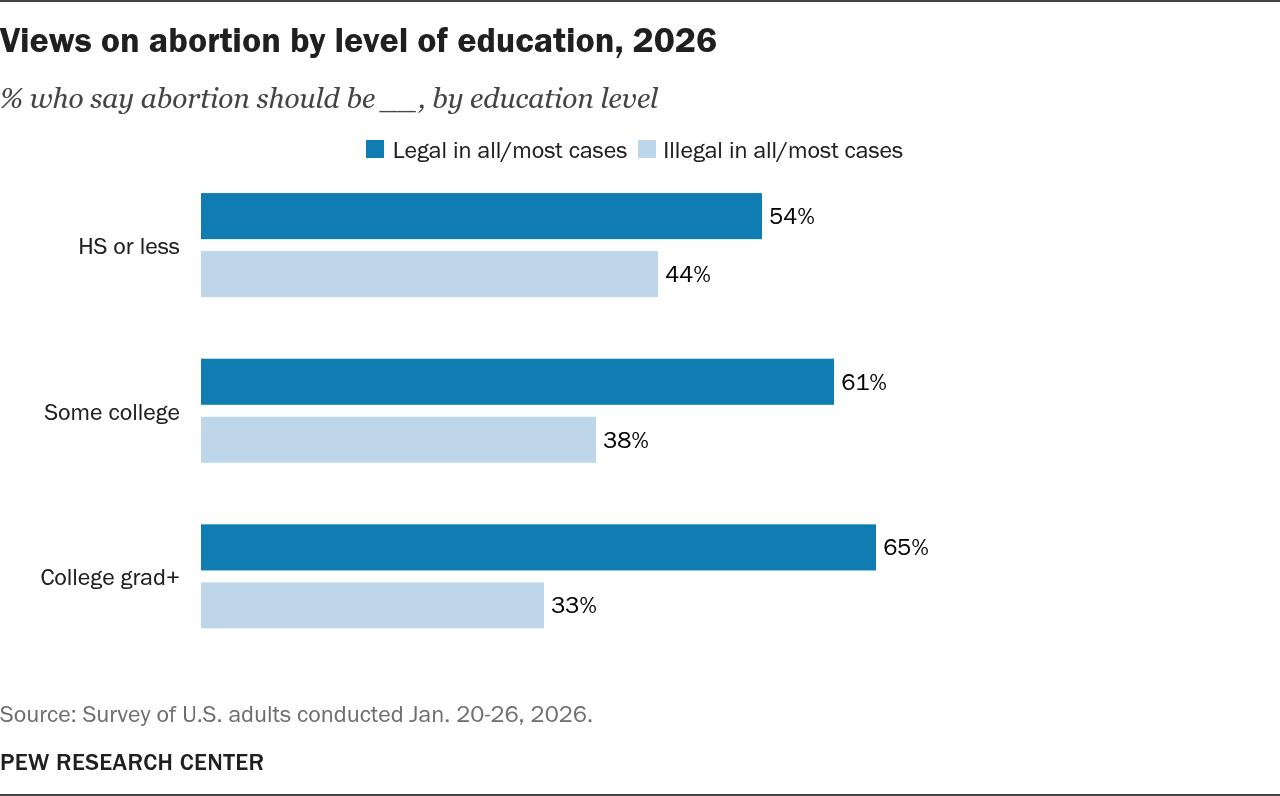
Views on abortion by level of education, 2026
About two-thirds of college graduates (65%) say abortion should be legal in all or most cases, as do 61% of adults with some college education. Among those with a high school diploma or less education, 54% say abortion should be legal in all or most cases, while 44% say it should be illegal in all or most cases.
| Level of education | Legal in all/most cases | Illegal in all/most cases |
|---|---|---|
| HS or less | 54% | 44% |
| Some college | 61% | 38% |
| College grad+ | 65% | 33% |
Views on abortion by state, 2023-24
In 34 states and the District of Columbia, more people say abortion should be legal in all or most cases than say it should be illegal in all or most cases. In one state – Arkansas – more people say abortion should be illegal rather than legal (57% vs. 41%).
In the 15 remaining states, the shares saying abortion should be legal and saying it should be illegal are not significantly different once the survey’s margins of error in these states are taken into account.
For more details, read “Americans’ views on abortion differ by state.”

| State | Net Legal in all/Most cases | Net Illegal in all/Most cases | No answer | Sample size | Margin of error (+/- pct. pts.) |
|---|---|---|---|---|---|
| All U.S. adults | 64% | 35% | 1% | 36908 | 0.8 |
| Alabama | 46% | 52% | 2% | 498 | 6.2 |
| Alaska | 62% | 37% | 2% | 350 | 7.7 |
| Arizona | 64% | 36% | <1% | 712 | 5.5 |
| Arkansas | 41% | 57% | 2% | 348 | 7.3 |
| California | 72% | 27% | 2% | 3746 | 2.4 |
| Colorado | 69% | 29% | 2% | 596 | 6.1 |
| Connecticut | 76% | 22% | 2% | 372 | 6.8 |
| Delaware | 73% | 26% | 1% | 345 | 7.4 |
| District of Columbia | 81% | 17% | 1% | 344 | 7.3 |
| Florida | 62% | 36% | 2% | 2114 | 3.1 |
| Georgia | 62% | 37% | 1% | 858 | 4.7 |
| Hawaii | 71% | 27% | 2% | 348 | 8.1 |
| Idaho | 48% | 52% | <1% | 346 | 7.1 |
| Illinois | 71% | 29% | 1% | 835 | 4.8 |
| Indiana | 52% | 46% | 2% | 655 | 5.0 |
| Iowa | 68% | 32% | <1% | 310 | 7.8 |
| Kansas | 55% | 42% | 3% | 352 | 7.4 |
| Kentucky | 54% | 45% | 1% | 428 | 6.2 |
| Louisiana | 54% | 45% | 1% | 454 | 6.2 |
| Maine | 72% | 26% | 2% | 343 | 7.2 |
| Maryland | 71% | 28% | 1% | 568 | 6.1 |
| Massachusetts | 78% | 19% | 3% | 573 | 5.8 |
| Michigan | 61% | 38% | 1% | 1004 | 4.2 |
| Minnesota | 69% | 31% | 1% | 533 | 5.7 |
| Mississippi | 44% | 54% | 2% | 338 | 7.7 |
| Missouri | 55% | 43% | 1% | 633 | 5.2 |
| Montana | 63% | 37% | 1% | 363 | 7.3 |
| Nebraska | 51% | 49% | <1% | 329 | 7.0 |
| Nevada | 73% | 26% | 1% | 363 | 7.6 |
| New Hampshire | 77% | 23% | <1% | 313 | 8.0 |
| New Jersey | 71% | 28% | 2% | 900 | 4.4 |
| New Mexico | 59% | 39% | 2% | 348 | 7.1 |
| New York | 74% | 25% | 2% | 2013 | 3.0 |
| North Carolina | 59% | 39% | 1% | 1109 | 4.1 |
| North Dakota | 54% | 46% | <1% | 367 | 6.8 |
| Ohio | 62% | 37% | 1% | 1539 | 3.4 |
| Oklahoma | 53% | 47% | <1% | 375 | 7.1 |
| Oregon | 72% | 27% | 1% | 462 | 6.7 |
| Pennsylvania | 68% | 31% | 1% | 1446 | 3.6 |
| Rhode Island | 78% | 21% | 2% | 384 | 7.5 |
| South Carolina | 53% | 45% | 2% | 517 | 6.3 |
| South Dakota | 43% | 55% | 2% | 367 | 7.0 |
| Tennessee | 46% | 52% | 2% | 898 | 4.4 |
| Texas | 56% | 42% | 1% | 2988 | 2.5 |
| Utah | 50% | 49% | 1% | 340 | 7.3 |
| Vermont | 79% | 20% | 1% | 373 | 7.3 |
| Virginia | 63% | 36% | 1% | 906 | 4.5 |
| Washington | 69% | 31% | 1% | 878 | 4.7 |
| West Virginia | 54% | 46% | <1% | 335 | 7.0 |
| Wisconsin | 67% | 32% | 1% | 625 | 5.4 |
| Wyoming | 54% | 45% | 2% | 367 | 7.1 |
Note: The data in this fact sheet primarily comes from surveys conducted on the Center’s American Trends Panel (ATP). Here are the questions used in those surveys and information about the ATP methodology.