This is the 10th time Pew Research Center has measured restrictions on religion around the globe.115 This report, which includes data for the year ending Dec. 31, 2017, generally follows the same methodology as previous reports.
Pew Research Center uses two 10-point indexes – the Government Restrictions Index (GRI) and the Social Hostilities Index (SHI) – to rate 198 countries and self-governing territories on their levels of restrictions.116 This report analyzes changes in restrictions on an annual basis, focusing on the period from 2016 to 2017.
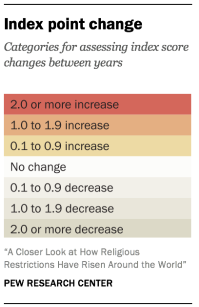
The study categorizes the direction and degree of change in each country’s scores in two ways, numerically and by percentile. First, countries are grouped into categories depending on the size of the numeric change in their scores from year to year on the two indexes: changes of 2 points or more in either direction, changes of at least 1 point but less than 2 points, changes of less than 1 point, or no change at all. (See chart at right.)
Changes in overall levels of restrictions are calculated for each country by comparing its scores on both indexes (the GRI and the SHI) from year to year. When a country’s scores on the GRI and the SHI changed in the same direction (both increased or both decreased), the greater amount of change determines the category. For instance, if the country’s GRI score increased by 0.8 and its SHI score increased by 1.5, the country was put into the overall “1.0-1.9 increase” category. When a country’s score increased on one index but decreased on the other, the difference between the amounts of change determines the grouping. For example, if the country’s GRI score increased by 2.0 and its SHI score decreased by 1.5, the country went into the overall “0.1-0.9 increase” category. When a country’s score on one index stayed the same, the amount of change on the other index was used to assign the category.
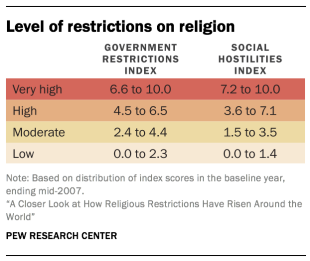
Second, this report categorizes the levels of government restrictions and social hostilities in each country by percentiles. As the benchmark, it uses the results from the baseline year of the study (the year ending in mid-2007). Scores in the top 5% on each index in mid-2007 were categorized as “very high.” The next highest 15% of scores were categorized as “high,” and the following 20% were categorized as “moderate.” The bottom 60% of scores were categorized as “low.” See the table to the right for the index score thresholds as determined from the mid-2007 data. These thresholds are applied to all subsequent years of data.
Overview of procedures
The methodology used by Pew Research Center to assess and compare restrictions on religion was developed by former Pew Research Center senior researcher and director of cross-national data Brian J. Grim in consultation with other Pew Research Center staff members, building on a methodology that Grim and Professor Roger Finke developed while at Penn State University’s Association of Religion Data Archives.117 The goal was to devise quantifiable, objective and transparent measures of the extent to which governments and societal groups impinge on the practice of religion. The findings were used to rate countries and self-governing territories on two indexes that are reproducible and can be periodically updated.
This research goes beyond previous efforts to assess restrictions on religion in several ways. First, Pew Research Center coded (categorized and counted) data from more than a dozen published cross-national sources, providing a high degree of confidence in the findings. Pew Research Center coders looked to the sources for only specific, well-documented facts, not opinions or commentary.
Second, Pew Research Center staff used extensive data-verification checks that reflect generally accepted best practices for such studies, such as double-blind coding (coders do not see each other’s ratings), inter-rater reliability assessments (checking for consistency among coders) and carefully monitored protocols to reconcile discrepancies among coders.
Third, the coding took into account whether the perpetrators of religion-related violence were government or private actors. The coding also identified how widespread and intensive the restrictions were in each country.
Fourth, one of the most valuable contributions of the indexes and the questions used to construct them (see the section on the coding instrument on page 70) is their ability to chart change over time.
Countries and territories
The 198 countries and self-administering territories covered by the study contain more than 99.5% of the world’s population. They include 192 of the 193 member states of the United Nations as of 2017, plus six self-administering territories – Kosovo, Hong Kong, Macau, the Palestinian territories, Taiwan and Western Sahara.118 Reporting on these territories does not imply any position on what their international political status should be, only recognition that the de facto situations in these territories require separate analysis.
Although the 198 countries and territories vary widely in size, population, wealth, ethnic diversity, religious makeup and form of government, the study does not attempt to adjust for such differences. Poor countries are not scored differently on the indexes than wealthy ones. Countries with diverse ethnic and religious populations are not “expected” to have more social hostilities than countries with more homogeneous populations. And democracies are not assessed more leniently or harshly than authoritarian regimes.
Information sources
In the latest year of the study, Pew Research Center identified 20 widely available, frequently cited sources of information on government restrictions and social hostilities involving religion around the world. This study includes four sources that were not used in the baseline report on religious restrictions. (See page 69 for more details on the new information sources.)
The primary sources, which are listed below, include reports from U.S. government agencies, several independent, nongovernmental organizations and a variety of European and United Nations bodies. Although most of these organizations are based in Western countries, many of them depend on local staff to collect information across the globe. As previously noted, Pew Research Center did not use the commentaries, opinions or normative judgments of the sources; the sources were combed only for factual information on specific policies and actions.
Primary sources for 2017
- Country constitutions
- U.S. State Department annual reports on International Religious Freedom
- U.S. Commission on International Religious Freedom annual reports
- U.N. Special Rapporteur on Freedom of Religion or Belief reports
- Human Rights First reports in first and second years of coding; Freedom House reports in subsequent years of coding
- Human Rights Watch topical reports
- International Crisis Group country reports
- United Kingdom Foreign & Commonwealth Office annual report on human rights
- Council of the European Union annual report on human rights
- START Global Terrorism Database at the University of Maryland
- European Network Against Racism Shadow Reports
- United Nations High Commissioner for Refugees reports
- U.S. State Department annual Country Reports on Terrorism
- Anti-Defamation League reports
- U.S. State Department Country Reports on Human Rights Practices
- Uppsala University’s Uppsala Conflict Data Program, Armed Conflict Database
- Human Rights Without Frontiers “Freedom of Religion or Belief” newsletters
- Amnesty International Country Profiles
- United Nations High Commissioner for Refugees Population Statistics Database
- Internal Displacement Monitoring Centre Global Internal Displacement Database
U.S. government reports with information on the situation in the United States
- U.S. Department of Justice “Religious Freedom in Focus” newsletters and reports
- FBI Hate Crime Reports
As noted, this study includes four sources that were not included in Pew Research Center’s first report on global restrictions on religion: Freedom House reports; Uppsala University’s Armed Conflict Database; the “Freedom of Religion or Belief” newsletters of Human Rights Without Frontiers; and the Global Terrorism Database.
The Freedom House reports have replaced Human Rights First reports, which have not been updated since mid-2008. The Uppsala Armed Conflict Database provides information on the number of people affected by religion-related armed conflicts, supplementing other sources. The Human Rights Without Frontiers “Freedom of Religion or Belief” newsletters have replaced the Hudson Institute publication “Religious Freedom in the World” (by Paul Marshall), which has not been updated since its release in 2008. Human Rights Without Frontiers is a nongovernmental organization based in Brussels that has affiliated offices throughout the world.
Since 2013, Pew Research Center has used data from the Global Terrorism Database, maintained by the University of Maryland’s National Consortium for Terrorism and Responses to Terrorism (START), along with the International Crisis Group’s country reports, Uppsala University’s Armed Conflict Database and the State Department’s annual Country Reports on Terrorism, for information on religion-related terrorism. (One source used in earlier reports, the U.S. government’s Worldwide Incident Tracking System, or WITS, is no longer available online.) Prior to 2013, the report relied only on the International Crisis Group reports, the Uppsala database and the State Department reports for information on religion-related terrorism. The Global Terrorism Database is one of the most comprehensive sources on terrorism around the world and is the source for the U.S. State Department’s Country Reports on Terrorism. The addition of this source thus provides greater context and information on terrorism without biasing the reporting through the addition of information that was not previously available.
While some of the increases in religious restrictions noted in this study could reflect the use of more up-to-date and/or better information sources, Pew Research Center staff monitor the impact of source information variability each year and have found no evidence of overall informational bias. (For additional discussion, see the “Potential Biases” section in the 2014 report, “Religious Hostilities Reach Six-Year High.”)
The coding instrument
As explained in more detail below, Pew Research Center staff developed a battery of questions similar to a survey questionnaire. Coders consulted the primary sources in order to answer the questions separately for each country. While the U.S. State Department’s annual reports on International Religious Freedom generally contained the most comprehensive information, the other sources provided additional factual detail that was used to settle ambiguities, resolve contradictions and help in the proper scoring of each question.
The questionnaire, or coding instrument, generated a set of numerical measures on restrictions in each country. It also made it possible to see how government restrictions intersect with broader social tensions and incidents of violence or intimidation by private actors. The coding instrument with the list of questions used for this report is shown in Appendix D.
The coding process required the coders to check all the sources for each country. Coders determined whether each source provided information critical to assigning a score; had supporting information but did not result in new facts; or had no available information on that particular country. Multiple sources of information were available for all countries and self-administering territories with populations greater than 1 million. Most of the countries and territories analyzed by Pew Research Center were multi-sourced; only small (predominantly island) countries had a single source, namely the State Department reports.
Coding the United States presented a special problem since it is not included in the State Department’s annual reports on International Religious Freedom. Accordingly, Pew Research Center coders also looked at reports from the U.S. Department of Justice and the FBI on violations of religious freedom in the United States, in addition to consulting all the primary sources, including reports by the United Nations, Human Rights Watch, Freedom House, the International Crisis Group and the UK Foreign & Commonwealth Office, many of which contain data on the United States.
The coding process
Pew Research Center employed strict training and rigorous coding protocols to make its coding as objective and reproducible as possible. Coders worked directly under an experienced researcher’s supervision, with additional direction and support provided by other Pew Research Center researchers. The coders underwent an intensive training period that included a thorough overview of the research objectives, information sources and methodology.
Countries were double-blind coded by two coders (coders did not see each other’s ratings), and the initial ratings were entered into an electronic document (coding instrument) including details on each incident. The coders began by filling out the coding instrument for each country using the information source that had the most comprehensive information. The protocol for each coder was to answer every question on which information was available in the initial source. Once a coder had completed that process, he or she then turned to the other sources. As new information was found, this was also coded and the source duly noted. Whenever ambiguities or contradictions arose, the source providing the most detailed, clearly documented evidence was used.
After two coders had separately completed the coding instrument for a particular country, their scores were compared by a research analyst. Areas of discrepancy were discussed at length with the coders and were reconciled in order to arrive at a single score on each question for each country. The data for each country were then combined into a master file, and the answers and substantiating evidence were entered into a database.
After data collection for all countries was completed, Pew Research Center coders and researchers compared the scores from calendar year 2017 with those from the previous year, ending Dec. 31, 2016. They identified scores that had changed and analyzed the substantiating evidence for each year to make sure the change was substantive and not the result of coder error. Throughout this process, the coding instrument itself was continually monitored for possible defects. The questions were designed to be precise, comprehensive and objective so that, based on the same data and definitions, the coding could be reliably reproduced by others with the same results. At the same time, Pew Research Center has attempted to minimize changes to the coding instrument as much as is possible to ensure all changes between years are the result of actual changes in restrictions and hostilities, not changes in methodology.
Pew Research Center staff generally found few cases in which one source contradicted another. When contradictions did arise – such as when sources provided differing estimates of the number of people displaced due to religion-related violence – the source that cited the most specific documentation was used. The coders were instructed to disregard broad, unsubstantiated generalizations regarding abuses and to focus on reports that contained clear, precise documentation and factual details, such as names, dates and places where incidents occurred.
Pew Research Center staff compared coders’ scores for all questions for each of the 198 countries and territories included in the study, computing the degree to which the scores matched. The inter-rater reliability score across all variables was 0.69. This score is similar to scores in the previous two reports in this series (0.70 and 0.74). Scores at or near 0.7 are generally considered good.
The data-verification procedures went beyond the inter-rater reliability statistics. They also involved comparing the answers on the main measures for each country with other closely related questions in the data set. This provided a practical way to test the internal reliability of the data.
In previous years, Pew Research Center staff also checked the reliability of the coded data by comparing them with similar, though more limited, religious restrictions data sets. In particular, published government and social regulation of religion index scores are available from the Association of Religion Data Archives (for three years of data) and the Hudson Institute (for one year of data), which makes them ideal measures for cross-validation. The review process found very few significant discrepancies in the coded data; changes were made only if warranted by a further review of the primary sources.
Restriction of religion indexes
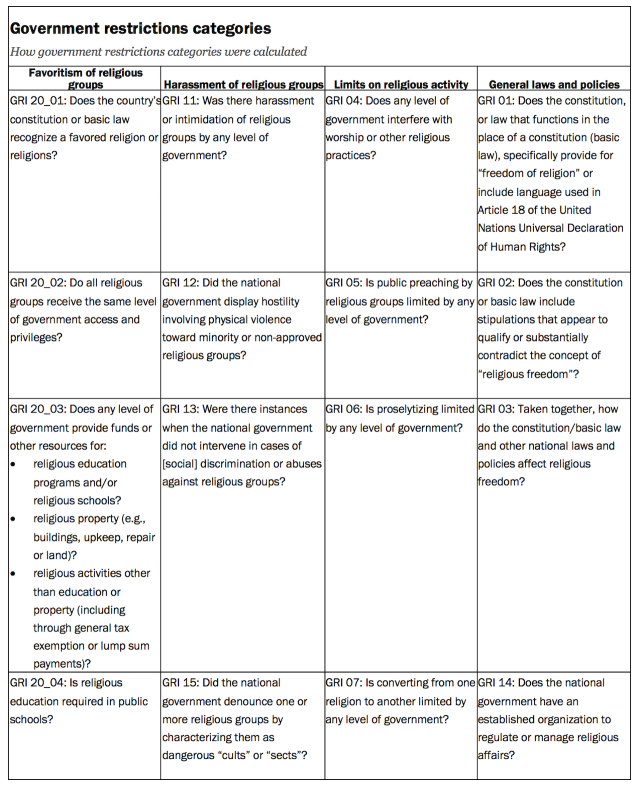
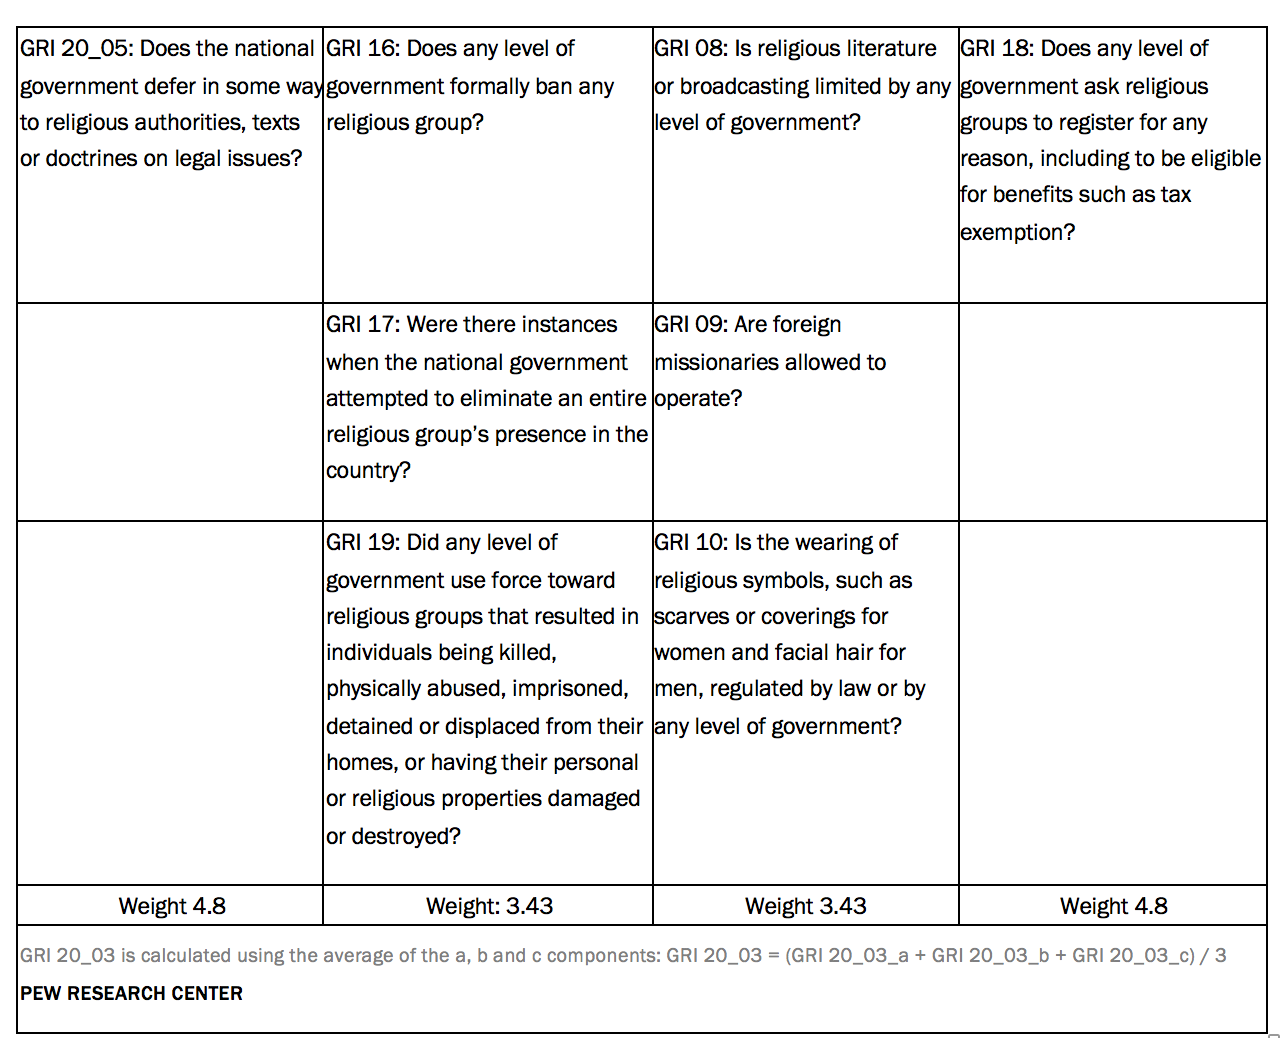
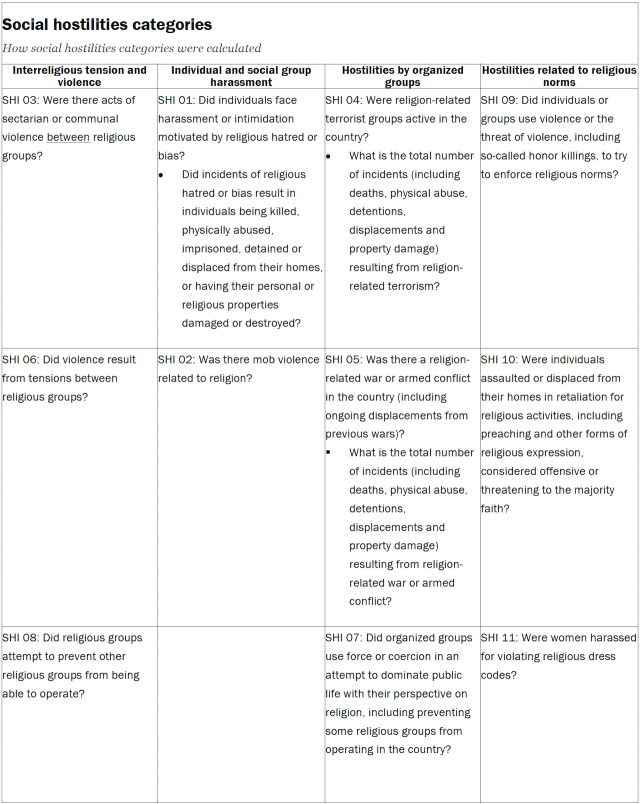
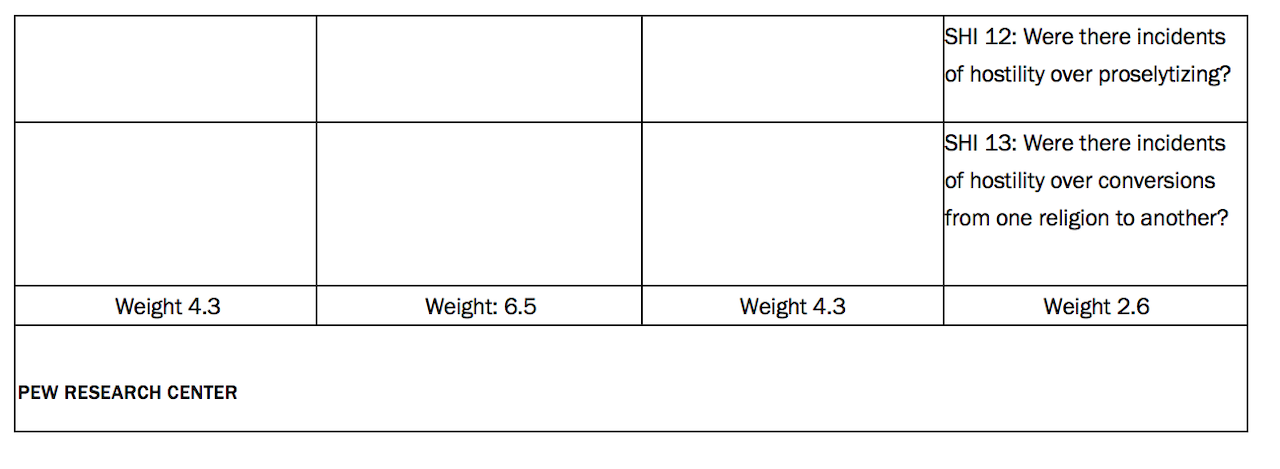
The Government Restrictions Index is based on 20 indicators of ways that national and local governments restrict religion, including through coercion and force. The Social Hostilities Index is based on 13 indicators of ways in which private individuals and social groups infringe on religious beliefs and practices, including religiously biased crimes, mob violence and efforts to stop particular religious groups from growing or operating. The study also counted the number and types of documented incidents of religion-related violence, including terrorism and armed conflict.
Government Restrictions Index
Coding multiple indicators makes it possible to construct a Government Restrictions Index of sufficient gradation to allow for meaningful cross-national comparisons. An additional advantage of using multiple indicators is that it helps mitigate the effects of measurement error in any one variable, providing greater confidence in the overall measure.
Pew Research Center coded 20 indicators of government restrictions on religion (see Appendix D: Summary of results). These 20 items were added together to create the GRI. In two cases, these items represent an aggregation of several closely related questions: Measures of five types of physical abuses are combined into a single variable (GRI Q.19), and seven questions measuring aspects of government favoritism are combined into an overall favoritism scale (GRI Q.20 is a summary variable showing whether a country received the maximum score on one or more of the seven questions).
The GRI is a fine-grained measure created by adding the 20 items on a 0-to-10 metric, with zero indicating very low levels of government restrictions on religion and 10 indicating very high levels of restrictions. The 20 questions that form the GRI are coded in a standard scale from zero to 1 point, while gradations among the answers allowed for partial points to be given for lesser degrees of the particular government restriction being measured. The overall value of the index was calculated and proportionally adjusted – so that it had a maximum value of 10 and a possible range of zero to 10 – by dividing the sum of the variables by two.
A test of whether the 20 items were statistically reliable as a single index produced a scale reliability coefficient of 0.90 for calendar year 2017. Since coefficients of 0.7 or higher are generally considered acceptable, it was statistically appropriate to combine these 20 items into a single index.
Social Hostilities Index
In addition to government restrictions, violence and intimidation in societies also can limit religious beliefs and practices. Accordingly, Pew Research Center staff tracked more than a dozen indicators of social impediments on religion. Once again, coding multiple indicators made it possible to construct an index that shows gradations of severity or intensity and allows for comparisons among countries. The summary of results contains the 13 items used by Pew Research Center staff to create the Social Hostilities Index.
The SHI was constructed by adding together the 13 indicators based on a 0-to-10 metric, with zero indicating very low impediments to religious beliefs and practices and 10 indicating very high impediments. The various questions that form the index are coded in a standard scale from zero to 1 point, while gradations among the answers allow for partial points to be given for lesser degrees of the particular hostilities being measured. The indicators were added together and set to have a possible range of zero to 10 by dividing the sum of the variables by 1.3.
As with the Government Restrictions Index, various types of violence and intimidation were combined. A test of whether these 13 items were statistically reliable as a single index produced a scale reliability coefficient of 0.85. Since coefficients of 0.7 or higher are generally considered acceptable, it was statistically appropriate to combine these items into a single index.
How examples are coded
Examples of each type of government restriction or social hostility are generally counted in a single measure on the GRI or SHI. For instance, a restriction on proselytizing (sharing one’s faith with the intent of persuading another to join the faith) is not also counted as a restriction on conversion (an individual changing their religion). In some situations, however, an individual restriction or hostility may be part of a broader set of restrictions or hostilities. For instance, a mob attack by members of one religious group on an individual of another religion may be an isolated event and counted just under question SHI Q.2: Was there mob violence related to religion? However, if such an attack triggers repeated attacks between religious groups, it also might be an indication of sectarian or communal violence, which by definition involves two or more religious groups facing off in repeated clashes. In such a case, the mob attack also would be counted under question SHI Q.3: Were there acts of sectarian or communal violence between religious groups? (See the summary of results.)
Effects of consolidating to a new database
For the first few years of this study, information on the number, types and locations of incidents of government force and social violence toward religious groups as well as deference to religious authorities in matters of law were coded at the province level. (See example of data coding on pages 45-48 of the December 2009 baseline report.) Each year, the province numbers were summed and put into separate country-level files. Following the publication of the August 2011 report, Pew Research Center staff created a database that integrated all province- and country-level data on religious restrictions. During this process, Pew Research Center staff reviewed any discrepancies between province files and the sums that had been transferred to the country files and made appropriate corrections. The adjustments made were relatively minor and had small effects on index scores for countries, on average less than 0.005 points on the 10-point indexes. Consolidating the data into a database also entailed a review of the data on harassment of religious groups. In particular, instances of harassment from the year ending in mid-2007 were stored as open-ended questions, and in a few cases they were recoded to match the categories used in subsequent years.
Beginning with data covering 2012, Pew Research Center stopped collecting data at the province level; all data are coded at the country level.
Changing time period of analysis
This is the seventh time Pew Research Center has analyzed restrictions on religion in a calendar year. Previous reports analyzed 12-month periods from July 1-June 30 (e.g., July 1, 2009-June 30, 2010). The shift to calendar years was made, in part, because most of the primary sources used in this study are based on calendar years.
Because of the shift in time frame, previous studies did not report directly on incidents that occurred during the period from July 1-Dec. 31, 2010. While this misses some incidents that occurred during the second half of 2010, events that had an ongoing impact – such as a change to a country’s constitution or the outbreak of a religion-related war – were captured by the coding. Researchers for the study carefully reviewed the situation in each country and territory during this six-month period and made sure that restrictions with an ongoing impact were not overlooked.
Religion-related terrorism and armed conflict
Terrorism and war can have huge direct and indirect effects on religious groups, including destroying religious sites, displacing whole communities and inflaming sectarian passions. Accordingly, Pew Research Center tallied the number, location and consequences of religion-related terrorism and armed conflict around the world, as reported in the same primary sources used to document other forms of intimidation and violence. However, war and terrorism are sufficiently complex that it is not always possible to determine the degree to which they are religiously motivated or state sponsored. Out of an abundance of caution, this study does not include them in the Government Restrictions Index. They are factored instead into the index of social hostilities involving religion, which includes one question specifically about religion-related terrorism and one question specifically about religion-related war or armed conflict. In addition, other measures in both indexes are likely to pick up spillover effects of war and terrorism on the level of religious tensions in society. For example, hate crimes, mob violence and sectarian fighting that occur in the aftermath of a terrorist attack or in the context of a religion-related war would be counted in the Social Hostilities Index, and laws or policies that clearly discriminate against a particular religious group would be registered on the Government Restrictions Index.
For the purposes of this study, the term “religion-related terrorism” is defined as premeditated, politically motivated violence perpetrated against noncombatants by subnational groups or clandestine agents that have some identifiable religious ideology or religious motivation. It also includes acts carried out by groups that have a nonreligious identity but affect religious personnel, such as clergy. Readers should note that it is the political character and motivation of the groups, not the type of violence, that is at issue here. For instance, a bombing would not be classified as religion-related terrorism if there was no clearly discernible religious ideology or bias behind it unless it was directed at religious personnel. Religion-related war or armed conflict is defined as armed conflict (a conflict that involves sustained casualties over time or more than 1,000 battle deaths) in which religious rhetoric is commonly used to justify the use of force, or in which one or more of the combatants primarily identifies itself or the opposing side by religion.
Changes to Somalia’s coding
Starting with data covering 2013, researchers changed the way they coded government restrictions in Somalia. In previous years of the study, researchers had coded actions by the al-Shabaab rebel group as government restrictions, largely because the group effectively controlled large swathes of Somali territory. The extent of al-Shabaab control over Somali territory decreased in calendar year 2013, so researchers did not code their actions as government restrictions but rather as social hostilities. Researchers continued to follow this policy when coding data for 2017.
Crimea coding
Starting with data covering 2015, researchers coded incidents occurring in Crimea as part of Russia’s GRI and SHI score. This is to reflect Russia’s de facto control over Crimea, and is not intended as a Pew Research Center position on the de jure status of the territory, which the United Nations recognizes as part of Ukraine.119
Changes to Yemen’s coding
Starting with data covering 2016, researchers changed the way they coded social hostilities in Yemen. In previous years of the study, researchers had coded actions by Houthi rebels as social hostilities. In 2016, however, Houthis formed their own government and had control of territory that is home to more than half of Yemen’s population.120 For this reason, researchers coded actions by the Houthi in 2016 as government restrictions rather than social hostilities and continued to do so in 2017.
Displacement coding
Starting with data covering 2016, researchers changed the way they coded displacement caused by religion-related conflict or terrorism. Previously, researchers would record displacement figures that were reported in any sources. During the coding period covering 2015, researchers continued to code displacement figures in this way but also recorded displacement figures from the United Nations High Commissioner for Refugees as well as the Internal Displacement Monitoring Centre in order to compare the results. Researchers found that the figures from the UNHCR and IDMC more closely matched United Nations estimates for new displacements in the calendar year than did the previous method of capturing displacements, which tended to overestimate the number of new displacements in a coding year because the figures often included the totalnumber of displaced people from a country and not necessarily the newly displaced. Therefore, beginning with the data covering 2016, researchers exclusively used UNHCR and IDMC figures to more conservatively estimate the number of new displacements in the coding year. Displacement was only coded in countries with active religion-related conflict or terrorism in order to avoid including displacements from other types of conflicts or terrorism.
Country constitution audit
Researchers conducted an audit of country constitutions for coding covering the years 2007-2014. While the vast majority of country constitutions were correctly coded as to whether they included religious freedom provisions, there were a few countries where the coding was amended. These included Mexico, Costa Rica, Fiji, Iran, Jamaica, the Dominican Republic, Uruguay, Cameroon, Kenya and Mozambique. These amendments resulted in minimal changes in these countries’ overall GRI scores and did not alter overall trends represented in previous reports. Two countries – Mexico and Costa Rica – had score changes that pushed them from one category to another in 2014. Mexico’s 2014 GRI score decreased from “high” to “moderate”, while Costa Rica’s 2014 GRI score increased from “low” to “moderate.”
Potential biases
As noted earlier, the primary sources indicate that the North Korean government is among the most repressive in the world, including toward religion. But because independent observers lack regular access to North Korea, the sources are unable to provide the kind of specific, timely information that forms the basis of this report. Therefore, North Korea is not included on either index.
This raises two important issues concerning potential information bias in the sources. The first is whether other countries that limit outsiders’ access and that may seek to obscure or distort their record on religious restrictions were adequately covered by the sources. Countries with relatively limited access have multiple primary sources of information that Pew Research Center used for its coding. Each is also covered by other secondary quantitative data sets on religious restrictions that have used a similar coding scheme, including earlier years of coded State Department report data produced by Grim at Penn State’s Association of Religion Data Archives (ARDA) project (four data sets); independent coding by experts at the Hudson Institute’s Center for Religious Liberty using indexes also available from ARDA (one data set); and content analysis of country constitutions conducted by the Becket Fund for Religious Liberty (one data set). Pew Research Center staff used these for cross-validation. Thus, contrary to what one might expect, even most countries that limit access to information tend to receive fairly extensive coverage by groups that monitor religious restrictions.
The second key question – the flipside of the first – is whether countries that provide freer access to information receive worse scores simply because more information is available on them. As described more fully in the methodology in the baseline report, Pew Research Center staff compared the length of State Department reports on freer-access countries with those of less-free-access countries. The comparison found that the median number of words was approximately three times as large for the limited-access countries as for the open-access countries. This suggests that problems in freer-access countries are generally not overreported in the State Department reports.
Only when it comes to religion-related violence and intimidation in society do the sources report more problems in the freer-access countries than in the limited-access ones. However, the Social Hostilities Index includes several measures – such as SHI Q.8 (“Did religious groups themselves attempt to prevent other religious groups from being able to operate?”) and SHI Q.11 (“Were women harassed for violating religious dress codes?”) – that are less susceptible to such reporting bias because they capture general social trends or attitudes as well as specific incidents. With these limitations in mind, it appears that the coded information on social hostilities is a fair gauge of the situation in the vast majority of countries and a valuable complement to the information on government restrictions.
Data on social impediments to religious practice can more confidently be used to make comparisons among countries with sufficient openness, which includes more than nine-in-ten countries covered in the coding. An analysis by Grim and Richard Wike, Pew Research Center’s director of global attitudes research, tested the reliability of the State Department reports on social impediments to religious practice by comparing public opinion data with data coded from the reports in previous years by Grim and experts at Penn State. They concluded that “the understanding of social religious intolerance embodied in the State Department reports is comparable with the results of population surveys and individual expert opinion.”121
Coding harassment of specific religious groups
As in previous reports, this study provides a summary of the number of countries where specific religious groups faced government or social harassment. This is essentially a cross-tabulation of GRI.Q.11 (“Was there harassment or intimidation of religious groups by any level of government?”) and the first type of religious hatred or bias measured in SHI.Q.1.a. (“Did individuals face harassment or intimidation motivated by religious hatred or bias?”). For the purposes of this study, the definition of harassment includes any mention in the primary sources of an offense against an individual or group based on religious identity. Such offenses may range from physical attacks and direct coercion to more subtle forms of discrimination. But prejudicial opinions or attitudes, in and of themselves, do not constitute harassment unless they are acted upon in a palpable way.
As noted above, this study provides data on the number of countries in which different religious groups are harassed or intimidated. But the study does not assess either the severity or the frequency of the harassment in each country. Therefore, the results should not be interpreted as gauging which religious group faces the most harassment or persecution around the world.
Categories of government restrictions and social hostilities
The categories described in the Overview – included for the first time in this report – were created by grouping together index variables that share commonalities. They onlyinclude variables that are part of the GRI and SHI indexes. The following tables show the category groups and the variables included in each group.
To calculate the category values, the country’s scores for each of the variables in the category are added and multiplied by a propensity weight. This is because the categories have a different number of variables included, and the categories with more variables need to be weighed down so their scores will not always be higher than the categories with fewer variables included. The weight is calculated using the inverse of the probability of being in the category group. For example, a variable has a five out of 24 chance of being included in the general laws and policies category (five variables in the category, 24 government restrictions variables total). So the propensity score is: 1 / (5/24) = 4.8.
To place the GRI and SHI category scores on a 0-10 scale, the GRI category scores were multiplied by (10/24) and the SHI category scores were multiplied by (10/13).
Pew Research Center generally uses medians to show global and regional differences in scores on the full indexes (GRI and SHI). This decision was made more than a decade ago, at the beginning of the study, to prevent a few outliers (countries with extremely high or extremely low scores) from skewing the regional or global averages. Both the GRI and SHI are comprised of enough variables that median scores often reflect important differences between regions as well as changes in levels of restrictions over time.
For the eight subcategories of government restrictions and social hostilities described in this report, however, researchers chose a different approach. Since each subcategory includes a much smaller number of variables, global and regional means (as opposed to medians) allow for more granular analysis. If medians were used, year-over-year change in many regions (as well as globally) would be more difficult to see. In addition, regional median scores in certain subcategories would be zero, even though many countries in those regions (albeit fewer than half) have nonzero scores.