Hispanic Origin4
-

Among the 10 largest metropolitan areas by Hispanic population, Mexicans are the largest Hispanic origin group in eight. The Mexican share in these eight areas ranges from a low of 71% in the San Francisco metropolitan area to a high of 91% in San Antonio. In Miami and New York, by contrast, Mexicans are not the largest group. More than half (54%) of the Miami metropolitan area’s Hispanic population is Cuban. In the New York metropolitan area, Puerto Ricans are the largest Hispanic group, making up 27% of all Hispanics. They are closely followed by Dominicans, who make up 21% of the New York metropolitan area’s Hispanic population.
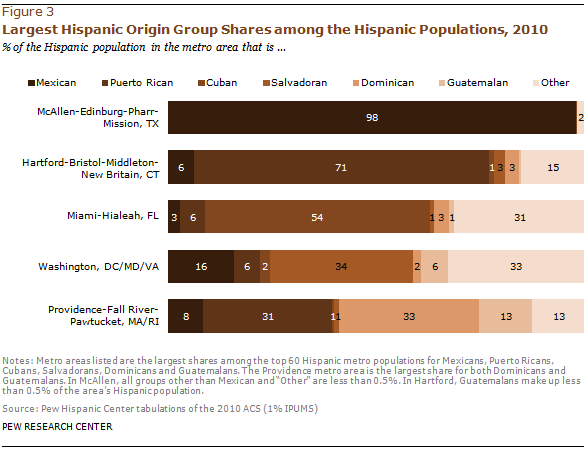
- Mexicans are the largest Hispanic origin group in 50 of the top 60 metro areas, and they account for 95% or more of the Hispanic population in eight metro areas in the top 60. The Mexican share is highest in McAllen, Texas, where they account for nearly all (98%) of the area’s Hispanics.5
- Among the top 60 metro areas, Hartford-Bristol-Middleton-New Britain, Conn.—the 53rd largest Hispanic population—has the largest share of Puerto Ricans among its Hispanic population (71%). Miami, whose Hispanic population is 54% Cuban, is the only top 60 metro area with a Hispanic population that is more than one-quarter Cuban. The greatest share of Hispanics that are Salvadoran (34%) reside in the Washington area, which is 12th largest by Hispanic population. The top 60 metro area with the highest share of Dominicans among its Hispanic population (33%) is Providence-Fall River-Pawtucket, Mass./R.I., which ranks 51st by Hispanic population. Providence also has the highest Guatemalan share (13%) among the top 60 metro areas.

Age
- Median ages among Hispanics in the top 10 Hispanic metro areas range from a low of 24 years (Phoenix) to a high of 39 years (Miami). For all U.S. Hispanics, the median age is 27. For the total U.S. population, the median age is 37.
- The Hispanic population residing in metropolitan areas tends to be younger than the total population in those areas. This is true in each of the top 10 Hispanic metropolitan populations, with the exception of Miami, where the median Hispanic age is only one year higher than that of the total population (39 years vs. 38 years).
-

In the Phoenix and Dallas areas, 38% of the Hispanic population is younger than 18—the highest among the top 10. By contrast, in Miami that share is only 20%, the lowest in the top 60. Four metro areas in the top 60 have Hispanic populations with 40% younger than age 18.6
- Miami also has the largest share of Hispanic adults ages 65 and older among the top 60 metro areas (15%). Dallas has the lowest share of elderly Latinos among the top 10 metro areas—just 3%. Among Hispanics in the Indianapolis, Ind. metro area (the 60th largest by Hispanic population), just 1% are ages 65 and older.
Nativity
-

In Miami, two-thirds (67%) of the Hispanic population is foreign born. This is the highest foreign-born share among Hispanics in any of the top 60 metro areas and the only top 10 metro area in which more than half of Hispanics are foreign born. By contrast, only 18% of Hispanics in the San Antonio area are foreign born. For U.S. Hispanics overall, the foreign-born share is 37%.
- Among the top 60 metro areas by Hispanic population, Corpus Christi, Texas has the lowest foreign-born share at 7%. Corpus Christi is the 46th largest metropolitan area by Hispanic population and is the only metropolitan area in the top 60 where fewer than one-in-ten Hispanics were born outside the U.S.


