The nation’s 35 million Hispanics comprise nearly 13 percent of the population. However, there are a far smaller number of Hispanic voters. In the November 2000 election, an estimated 5.9 million Latinos voted, comprising 5 percent of the total vote. The large difference between the size of the Latino population and of the Latino electorate is the result of several factors: The Latino population is overwhelmingly young. Immigrants make up more than half the voting-age population and a small share of them have become citizens. Finally, voter registration and turnout rates are relatively low among Latino citizens.
A Significant Proportion of the Hispanic Population is Ineligible to Vote
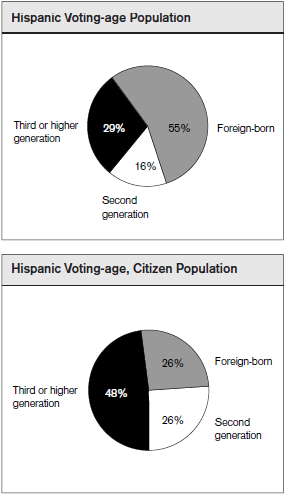
Sixty percent of Hispanics are not eligible to vote. More than 12 million Latinos, a third of the population, are less than 18 years of age. In addition, nearly 9 million voting-age Latinos are foreign-born and do not have U.S. citizenship. Among those Latinos who are eligible to vote, a little more than half are either immigrants who have acquired citizenship or their U.S.-born children, the second generation. Just under half of Latino eligible voters are third generation or higher, meaning that both their parents were born in the United States.
The proportion of Latino adults that are citizens varies widely among Latino national origin groups. All Puerto Ricans are native-born U.S. citizens regardless of whether they were born on the island of Puerto Rico or on the U.S. mainland. Some 72 percent of Latinos of Cuban origin are citizens compared to 58 percent of those of Mexican origin. A large share of Latinos who trace their roots to Central and South America are recent immigrants and only 46 percent are citizens.
Less than Half of Hispanic Voting-age Citizens Go to the Polls
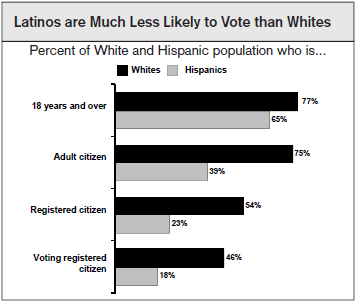
According to the Census Bureau’s Current Population Survey, 57 percent of Hispanic adult citizens were registered to vote in November 2000, the second lowest reported registration rate of major racial/ethnic groups (Asian and Pacific Islanders were lower at 52 percent). Latinos also trail in actual voting.
In November 2000, 79 percent of registered Hispanics reported voting, in comparison to 86 percent of registered non-Hispanic whites. Considering registration and voting in tandem, 45 percent of Hispanic adult citizens reported voting in November 2000.
Hispanic Voting Eligible Population is Growing
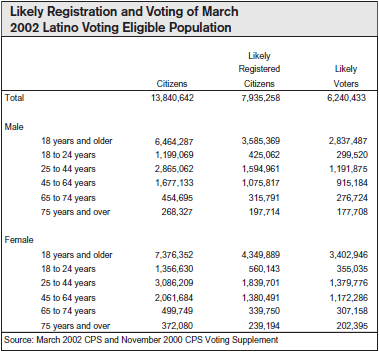
From November 1996 to November 2000 the Latino voting eligible population grew by 2 million persons. Much of this growth can be accounted for by naturalizations among Latino foreign-born adults. Naturalizations among persons from Latin American countries totaled 1.7 million from 1996 to 2000. Since November 2000 the Latino voting eligible population has grown by 700,000 persons.
If the Latino voting eligible population registers and votes this November in the same proportions as they did for the 2000 election, there would be nearly 8 million registered Latino voters and 6.2 million actual Latino voters. Looking ahead to the future, the number of Latino eligible voters is sure to grow. There are now some 2.8 million Latino 12-to-17 year olds who are native-born U.S. citizens. They all will be old enough to vote by November 2008.
Overview of the U.S. Hispanic Population
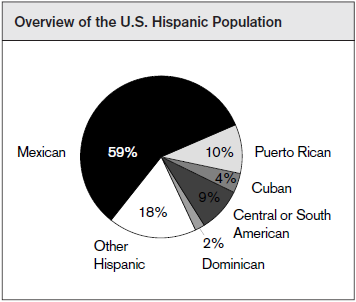
In the 2000 Census, some 35,306,000 persons living in the United States identifi ed themselves as being Hispanics. That represented a 142 percent increase over the 1980 Census count of 14,609,000 Hispanics.
Latinos of Mexican origin are by far the largest national origin group, representing about 60 percent of the Hispanic population. Puerto Ricans are the next largest and they are far behind, making up just 10 percent of all Latinos. The rest of the Hispanic population is divided among persons who trace their roots to many different nations.
Copies of this fact sheet are available online at www.kff.org or www.pewresearch.org/pewresearch-org/hispanic, or by calling the Foundation’s publications request line at (800) 656-4533 and requesting publication #3267.


