
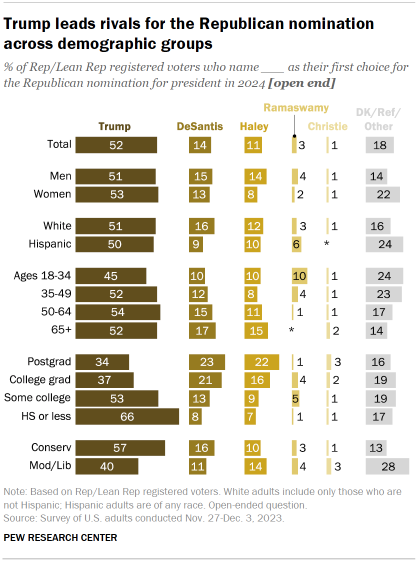
Donald Trump is the first choice of roughly half (52%) of Republican and Republican-leaning independent registered voters for the Republican nomination for president in 2024. Far smaller shares name Ron DeSantis (14%), Nikki Haley (11%), Vivek Ramaswamy (3%) or Chris Christie (1%) as their top choice.
About two-in-ten GOP voters (18%) name another person, report being undecided or decline to answer.
GOP candidate preferences vary by demographics
Republican voters ages 18 to 34 are slightly less likely than older Republican voters to say Trump is their first choice, though age differences on this question are modest overall.
Educational differences are more substantial: 66% of Republican voters with a high school education or less support Donald Trump, compared with 53% of those with some college experience, 37% of those with a four-year college degree and 34% of those with a postgraduate degree.
College-educated Republican voters are about twice as likely as those without college degrees to support either DeSantis or Haley – 40% of college graduates support one of these two candidates, compared with 19% of non-college graduates. (About a third of Republican and Republican-leaning registered voters have college degrees, including roughly one-in-ten who have postgraduate degrees.)
While a majority of conservative Republican voters (57%) support Trump, a smaller share of moderate and liberal Republican voters (40%) back the former president. Republican moderates and liberals are about twice as likely as conservatives to say they are undecided about who they prefer for the GOP nomination or decline to answer (28% vs. 13%).
Similar shares of Republican men and women and similar shares of White and Hispanic Republicans favor Trump. However, men are slightly more likely than women to favor Haley (14% vs. 8%) and White Republican voters express slightly greater support than Hispanic Republican voters for DeSantis (16% vs. 9%).
Republican voters’ satisfaction with the candidate field
Roughly seven-in-ten Republican voters (71%) say they would be satisfied if Trump became the Republican nominee in 2024, including about half (49%) who say they would be very satisfied.
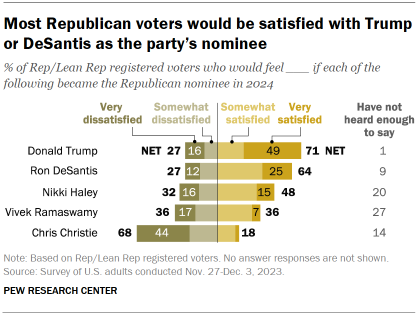
A majority (64%) also say they would be satisfied if DeSantis won the nomination, including 25% who would be very satisfied. About a quarter of Republican voters would be dissatisfied with either Trump or DeSantis (27% each).
About half of Republican voters (48%) would be satisfied if Haley were nominated, while about a third (32%) would be dissatisfied. Two-in-ten GOP voters say they have not heard enough about Haley to say.
Ramaswamy is less well known than Trump, DeSantis, Haley or Christie, with 27% of Republican voters saying they have not heard enough about him to have an opinion. Equal shares say they would be satisfied and dissatisfied (36% each) if Ramaswamy became the nominee.
About tw0-thirds of Republican voters (68%) would be dissatisfied if Christie were to become the nominee. Just 18% say they would be satisfied with this outcome.
How each candidate’s supporters feel about the rest of the field
A majority of Republican registered voters who name Trump as their first choice for the nomination (65%) nonetheless say they would be satisfied if DeSantis became the nominee. A slightly narrower majority of DeSantis supporters – 57% – say they would be satisfied with Trump as the nominee.
A majority of DeSantis supporters (64%) would be satisfied with Haley becoming the nominee. A similar share of Haley supporters (61%) would be satisfied with DeSantis.
However, most Haley supporters (68%) say they would be dissatisfied if Trump won the nomination, while just 31% would be satisfied. And Republican voters who support Trump are closely divided on the possibility of Haley as the Republican general election candidate: 41% say they would be dissatisfied, 39% say they would be satisfied.

Views of the Republican field and the primary election system
Just over half of Republican voters (54%) rate the overall field of candidates running for the nomination as either excellent (9%) or good (45%), while 35% describe the field as only fair and 11% rate it as poor.
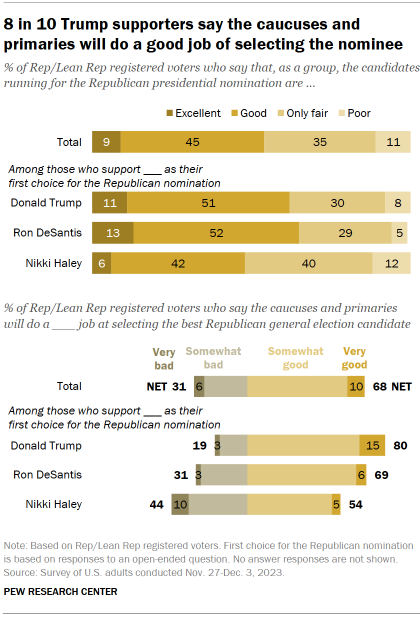
Similar shares of DeSantis (65%) and Trump supporters (62%) describe the group of candidates running for the nomination as excellent or good.
Haley supporters are less likely to describe the field this way, with 48% describing it as excellent or good and 52% describing it as only fair or poor.
Overall, 68% of Republican voters say the caucuses and primaries will do a good job of selecting the best candidate, though just 10% say they will do a very good job.
Views of how well the caucuses and primaries will do at selecting the best Republican candidate for the general election also vary by candidate support.
Eight-in-ten Trump supporters say the caucuses and primaries will do a very (15%) or somewhat (65%) good job of selecting the best candidate, compared with about seven-in-ten DeSantis supporters (69%) and a smaller share of Haley supporters (54%).
- In January 2020, 77% of Democratic and Democratic-leaning registered voters said that their caucuses and primaries would do a good job of selecting the best general election candidate.
How Republican voters view Trump’s impact on the Republican Party
A majority of Republican voters (62%) say Donald Trump has had a positive impact on the Republican Party since he entered politics. A quarter say that his impact has been negative, while 13% say that the former president has had neither a positive nor negative impact.
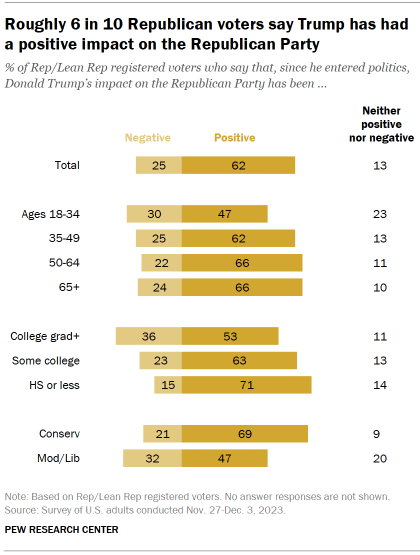
Views vary by age group: Republican voters under 35 are less positive about Trump’s impact than those ages 35 and older. About two-thirds of Republican voters ages 35 and older (65%) say Trump has had a positive impact on the party, compared with about half (47%) of Republican voters ages 18 to 34.
Republican voters under 35 are 12 percentage points more likely than older Republican voters to say that Trump’s impact has been neither positive nor negative (23% vs. 11%). Three-in-ten younger Republican voters say Trump’s impact has been negative, as do 24% of those ages 35 and older.
Views on Trump’s impact also vary by education: 71% of Republican voters with a high school education or less view Trump’s impact as positive, compared with 63% of those with some college experience and 53% of those with college degrees. Republican college graduates are more than twice as likely as those without any college experience to say Trump’s impact has been negative (36% vs. 15%).
There are ideological differences among Republican registered voters in these views as well. About seven-in-ten conservative Republican voters (69%) view Trump’s impact on the GOP in a positive light, while 47% of moderate and liberal Republican voters say the same. About a third of moderate and liberal Republican voters say that Trump’s impact has been negative, while 20% say it has been neither positive nor negative.


