
The public continues to express more confidence in the federal government’s career employees than in officials appointed by the president. However, the share of Americans who have a great deal or fair amount of confidence in career employees at federal agencies has declined since 2018.
The public is deeply skeptical about the motives of those who seek political office: Far more U.S. adults say these individuals do so in order to serve their own interests rather than to serve their communities. And most Americans are doubtful that if they reached out to their House member with a problem, that the representative would be likely to help them.
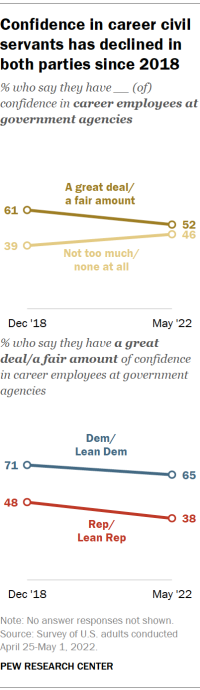
Confidence in government’s career employees drops
The share of Americans who have a great deal or a fair amount of confidence in career employees at government agencies who are not appointed by a president has declined by 9 percentage points since late 2018, from 61% to 52%.
Roughly one-in-ten adults (9%) now say they have a great deal of confidence in career government employees, while 44% have a fair amount of confidence. A third say they have not too much confidence in career civil servants, and 14% say they have no confidence in them at all.
Confidence in government employees has declined among both Republicans and Democrats since 2018. Among Republicans and independents who lean toward the Republican Party, 38% say they have a great deal or a fair amount of confidence in civil servants, down from 48% in December 2018.
Among Democrats and Democratic leaners, nearly two-thirds (65%) have a great deal (14%) or a fair amount (51%) of confidence in career civil servants, down from 71% nearly four years ago.
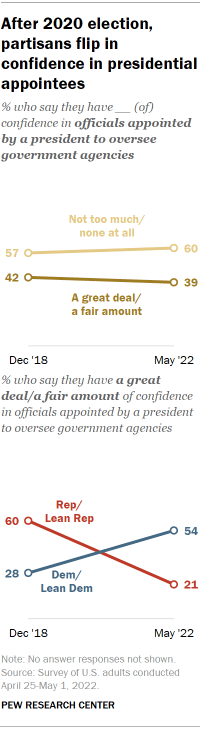
Overall confidence in officials appointed by a president to oversee government agencies has also decreased slightly since 2018. Nearly four-in-ten adults (39%) have a fair amount (35%) or a great deal (5%) of confidence in presidential appointees. Six-in-ten adults say they have not too much confidence (42%) or no confidence at all (18%) in these officials – a 3 point increase since 2018.
Confidence in officials appointed by a president to oversee government agencies is more closely related to partisanship than to confidence in career government employees.
Between December 2018, when Donald Trump was president, and May 2022, with Joe Biden midway through his term, Republicans became much less confident in presidential appointees; at the same time, Democrats became much more confident in them.
Today, about two-in-ten Republicans (21%) have a great deal (2%) or a fair amount (19%) of confidence in officials appointed by a president, compared with six-in-ten who expressed at least a fair amount of confidence in 2018. And a narrow majority of Democrats (54%) now have a great deal (6%) or a fair amount (48%) of confidence, compared with 28% in late 2018.
More say those who run for office do so to serve personal interests rather than their community
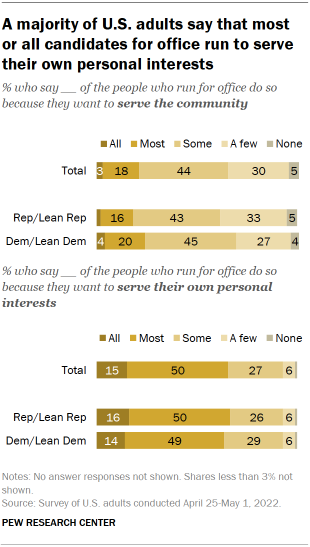
The public is skeptical of the motivations of those who run for local, state and federal elected offices. Nearly two-thirds (65%) say that at least some candidates run for office out of a desire to serve the community, but a much larger share (92%) say at least some political candidates seek office as a means of serving their own interests.
Relatively few Americans say all (3%) or most people (18%) who run for office do so because they want to serve the community; however, another 44% say some political office seekers are motivated by a desire to serve. About a third (35%) say few or no candidates run because they want to serve the community.
By contrast, 65% say all (15%) or most (50%) candidates for office are motivated by personal interests; another 27% say this is a factor for some candidates. Very few (7%) say few or no candidates run to advance their own interests.
Republicans and Democrats hold fairly similar views on the motivations of those who run for office.
Nearly identical shares in each party say that all or most of the people who run for office do so to serve personal interests (66% of Republicans, 64% of Democrats). However, Democrats are somewhat more likely than Republicans to say that all or most candidates run to serve the community (25% vs. 18%).
A substantial share of the public is particularly cynical about the motives of people who run for office: Three-in-ten adults say that all or most of those who run for office do so to serve their own personal interests and say that a few or none do so to serve the community.
Republicans are somewhat more likely to be in this group than Democrats, and those who lean toward a party are more likely than those who identify with that party to be in it: Four-in-ten Republican leaners, 33% of Democratic leaners, 30% of Republicans and 21% of Democrats say that all or most candidates for office run to serve their personal interests and that few or none do so to serve the community.
Few expect U.S. House members to be responsive to constituents
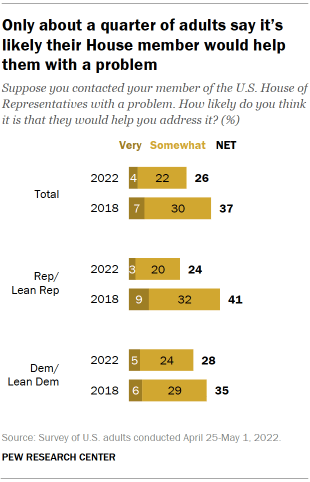
About a quarter of Americans (26%) say that, if they contacted their member of the U.S. House of Representatives with a problem, it is very (4%) or somewhat (22%) likely that the representative would help them address it. Nearly three times as many (73%) say that it is not very likely (45%) or not at all likely (29%) that their representative would assist them.
The share of the public who thinks it’s very or somewhat likely that their House representative would assist them with a problem has declined 11 points since 2018. There has been a decline among both Republicans and Democrats, though it is somewhat steeper for Republicans. Democrats currently hold a majority in the House; in 2018, Republicans had the majority.
Today, 24% of Republicans say it is at least somewhat likely that their representative would assist them, down from 41% four years ago. And 28% of Democrats say this, compared with 35% in 2018.
Americans who live in districts represented by a member of their own party are somewhat more likely than those who live in districts represented by a member of the other party to expect that their representative would help them address a problem if contacted.
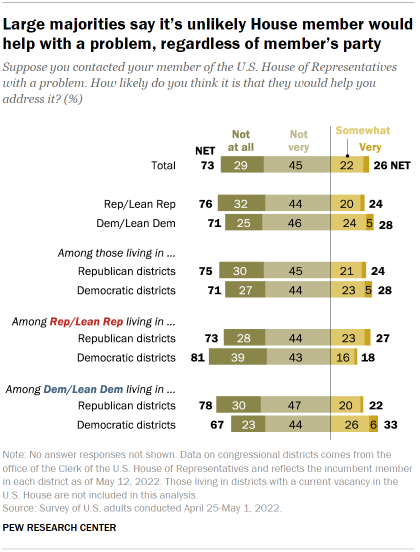
However, even among partisans who live in a district with a representative from the same party, relatively small shares say the House member would be likely to assist them.
Among Republicans, 27% of those represented by a Republican in the House say it is somewhat or very likely that their representative would assist them. Somewhat fewer Republicans (18%) living in districts represented by a Democrat say this.
A third of Democrats who are represented by a Democratic member in the House say it is somewhat or very likely that their representative would assist with a problem, compared with 22% of those who are represented by a Republican.
