Demographics
On the whole, both samples (even unweighted) fairly closely reflected the American public. In most demographic categories, both samples differed from U.S. Census figures by 4 percentage points — the statistical margin of error — or less.1
While both samples closely approximated the U.S. population across various age groups, they both included a slightly above-average percentage of women and below-average percentage of men than in the United States as a whole. The standard sample also slightly underrepresented whites.
The rigorous sample was slightly more affluent than the standard sample. Some 35% of the rigorous sample had family incomes of $50,000 or higher, for example, compared with 28% of the standard sample. Consequently, the more affluent rigorous sample provided a more accurate reflection of the public in higher income groups but underrepresented those earning $20,000 or less. In contrast, the standard sample overrepresented those in the middle-income range ($30,000 to under $50,000).
Both samples included above-average percentages of highly-educated Americans. The standard sample exceeded U.S. Census figures for the number of college graduates by 6 percentage points, while the rigorous sample was over by 11 percentage points. Similarly, the standard and rigorous samples underrepresented those with less than a high school education by 7 and 9 percentage points, respectively.
Political Attitudes2
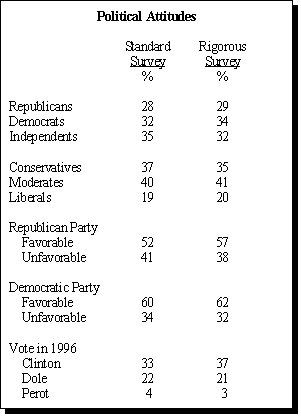
There were no significant differences in the way respondents in the standard and rigorous samples described themselves politically, in their views about human nature, or in how well-informed they were about current events. The distribution of Democrats, Republicans and Independents was nearly identical in both samples. Both samples also included similar proportions of self-described liberals and conservatives.

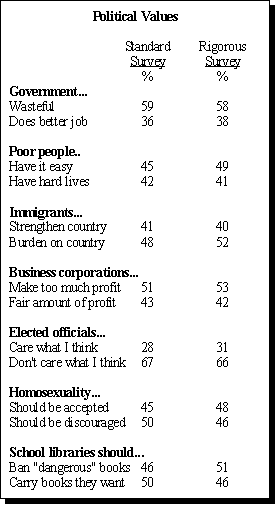
The Pew Research Center experiment provides little evidence that standard survey methods fail to represent the opinions of a more conservative segment of the population. Across eight questions on a range of political attitudes, none revealed a statistically significant difference between the two samples. Further, there is no consistent pattern of those in the rigorous sample holding more conservative opinions than those in the standard sample. For example, the rigorous sample included slightly more Clinton voters (37% vs. 33%) and larger percentages who blamed the Republican-controlled Congress for “things not getting done in Washington” (45% vs. 41%).
Both groups were equally well-informed about current events. Equal numbers in each sample could correctly identify Microsoft CEO Bill Gates, knew which party has a majority in the U.S. House of Representatives and knew that Bob Dole had recently loaned Newt Gingrich money to help pay off the House Speaker’s ethics fine.
As noted above, the two samples revealed the sharpest differences on several questions concerning racial issues. Slightly more people in the standard sample described their opinion of blacks as “very favorable” than in the rigorous sample. Those in the standard sample were also less likely than those in the rigorous sample to say blacks who can’t get ahead are “mostly responsible for their own condition.” On this question, the difference was a full 7 percentage points. In addition, a significantly larger majority of the rigorous sample (59% compared to 50%) oppose a national apology for slavery.
Comparisons based only on white respondents underscore these differences. In the rigorous sample, for example, 64% of white respondents said blacks are responsible for their own situation, while 26% agreed that racial discrimination is the main reason why many black people cannot get ahead. This compares with a narrower 56%-31% split on the question in the standard sample.

These findings suggest that the racial attitudes of white Americans may be among the most difficult to measure in telephone surveys. This is especially true in polls conducted over just a few days because the views of people who are reluctant to participate in surveys differ noticeably on questions concerning racial minorities.
Compared to whites who agreed to be interviewed when first called, those who initially refused to be interviewed — and agreed only when they were called back again — were:
Less favorable toward minority groups. Only 15% held a “very favorable” opinion of blacks (compared to 22%), and just 12% held a “very favorable” opinion of Hispanics (compared to 18%).
Substantially more willing to blame blacks rather than racial discrimination as the reason more black people can’t get ahead these days. Fully 71% of the initial refusers blamed blacks and only 21% blamed discrimination. This compares with a 60% to 29% split among those who initially agreed to participate in the survey.
Notably, this gap between respondents who initially agreed to be interviewed and those who at first refused is not apparent on other types of issues. Opinions concerning poor people, elected officials, business corporations and government waste are similar among both cooperators and refusers. Those who are reluctant to participate in surveys differ from others primarily in their attitudes toward racial minorities.
Lifestyles
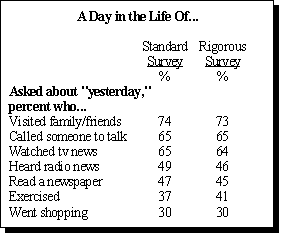
The people in the standard and rigorous sample are nearly the same in their patterns of media use, daily activities and feelings about other people. Essentially equal numbers of each sample said they watched television news (64% in the rigorous, 65% in the standard), read a newspaper (45%, 47%) or listened to news on the radio (46%, 49%) “yesterday.” The two samples also included similar percentages of people who listen to radio shows, watch daytime talk shows on television, and use a computer at home or work.
The two groups are also similar in how they view others. Some 58% of the rigorous sample and 55% of the standard sample said “most of the time people try to be helpful,” while 38% and 37%, respectively, said people are “mostly looking out for themselves.” Other questions concerning trust in others revealed even smaller differences between the two samples.

Those in the rigorous sample seemed slightly more secure in their ability to call on others. Nearly half (47%) of the rigorous sample said they can turn to “many” people when they need help, compared to 41% of the standard sample. But there were no discernible differences between the two groups in terms of time spent doing volunteer work or church attendance. Equal numbers said they feel safe when walking in their neighborhood after dark, as well.
Attitudes toward Surveys
The people in the rigorous sample were no more suspicious of public opinion polls than those in the standard sample — nor were there any differences between those who agreed to be interviewed the first time they were asked and those who initially refused and only agreed when called back again. Majorities of both samples (68% in the rigorous, 66% in the standard) said most opinion polls work “for the best interest” of the public, although similar majorities (65%, 67%) doubted that a random sample of 1,500 to 2,000 people can “accurately reflect the views” of the nation. Finally, majorities in both surveys (78% in the rigorous, 75% in the standard) said they would participate in a survey again.
Structure of Opinion
Not only were there few differences between the standard and rigorous surveys in the aggregate, but there was also no evidence of deeper, underlying differences in the structure of public opinion between the two samples. By examining the extent to which people gave similar responses to questions raising similar issues, this section provides additional evidence that the standard and rigorous samples are not substantially different from one another.
On several topics the survey included two or three questions that each addressed the same general issue. When people are asked two questions concerning the same general issue, most people would be expected to give similar answers to both questions. Respondents who identify themselves as Republicans, for example, would be expected to reflect their partisan leanings when asked to rate the parties. Presumably, they would give relatively high ratings to the Republican Party and low ratings to the Democratic Party.

The design of the survey made it possible to compare people’s responses to a set of two or three related questions on four different topics: government and politics, the political parties, race relations and human nature. Not surprisingly, people’s answers to four questions concerning the political parties were strongly associated with one another. Most respondents identified more closely with one party or the other, held a higher opinion of that party and blamed the other party for things “not getting done” in Washington. Similarly, people’s answers to three questions about human nature were consistent. Those who describe others as trustworthy are the same people who view others as “fair” and “helpful.”
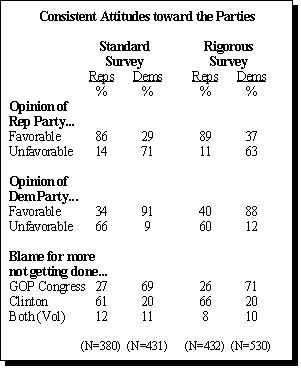
More importantly, however, the extent to which people’s answers are consistent across questions is the same in both the standard and rigorous samples. In the standard sample, 61% of Republicans blamed the Clinton administration more for not getting things done in Washington, while just 27% blamed the Republican-controlled Congress. In the rigorous sample, 66% of Republicans blamed the administration and 26% blamed Congress. The responses among Democrats, not surprisingly, were nearly the reverse — but the same in both the standard and rigorous samples.
This provides additional evidence that the two surveys produced few differences. People in the standard and rigorous samples not only held similar views across individual items, but the underlying structure of their political and social attitudes was also remarkably similar.3


