Website Analysis Methodology
This study examined the campaign websites of presidential candidates Donald Trump, Hillary Clinton and Bernie Sanders through an audit of design features, static content and original news items (news articles, press releases and videos) posted to their websites from May 1 through June 15, 2016. During this period, there were 220 original news items that consistently loaded and therefore allowed analysis.
The website audit examined each platform in late June.
This part of the analysis was an audit of design features and static content of the campaign websites, both to compare across the three candidates and to contrast with a similar audit of the campaign websites of Barack Obama and Mitt Romney conducted in 2012.
A preliminary test audit was conducted on May 9, 2016. A first formal audit was conducted on June 21-22, 2016. A second informal audit was conducted on June 29, 2016, to look for any changes, updates or redesigns to the sites.
The websites were captured using a program called Snagit and analyzed for the following variables:
- Grassroots involvement: This variable reflects the ways a visitor/supporter may become involved with the campaign. Researchers examined sites for whether they contained an event calendar, a fundraising page, an option to make calls for the candidate, sample scripts for making calls, options to choose states or issues to make calls about, an option to send tweets for the candidate, the ability to host events, links and information about registering to vote, a link to donate, the opportunity to contribute to a citizen blog or the ability to comment on the candidate’s content.
- Social networking: This variable reflects the ways a visitor/supporter may become involved with the candidate’s social media. Researchers looked for the existence of social media feeds and designated how many and which social media sites the campaign used.
- Newsroom: This variable reflects the ways the campaign delivers news and engages with the news media. Researchers checked for whether the site offers press releases, news articles, blog posts and videos.
- Targeting: This variable reflects the way a visitor/supporter may join different state, voter and issue groups to get tailored information based on the state chosen. Researchers looked for specific pages offering customized content for citizens in individual states or for the option to customize site content according to location as well as pages about specific issues and targeting specific voter groups.
Researchers captured content posted to the campaign websites during the period studied by saving HTML versions of the webpages containing these posts. Only content originating with the campaigns was captured for analysis. This excluded content from the Trump website’s “In the News” section, which reposted mainstream news articles about the candidate, and the Sanders website section “Democracy Daily,” which reposted digital news content from mainstream and liberal outlets.
Social Media Analysis Methodology
This analysis examined the social media activity of the three major party U.S. presidential candidates still vying for their party’s nomination by mid-May 2016. For this project, researchers analyzed publicly available data for the 389 Facebook posts and the 714 tweets left by these candidates on their campaign’ official Facebook and Twitter accounts from May 11-31, 2016, as well as metrics describing the public response to these posts.
Data acquisition
Before collecting data, the researchers identified the candidates’ official campaign accounts. Links to these accounts were provided by the campaigns’ main websites.
Donald Trump
Hillary Clinton
Bernie Sanders
Each candidate’s posts and tweets were collected through the Facebook and Twitter APIs using a custom script that captured data at least two days after the post time, and no more than one week after the post time, between May 17 and June 3, 2016. The API provided the full text of each post, along with the number and type of audience reactions (likes, retweets, shares, etc.), as well as metadata about the post such as when it was posted, if it was a retweet or contained any links, who was mentioned, etc. (see below).
Each time the script ran, it updated the number of audience responses for posts and tweets previously captured. To ensure we captured a comparable and relatively complete set of data, each post’s final number of reactions was capped at one week after the original post date. We have found in the past that, at least on Facebook, attention tends to dwindle 24 hours after the post date, so this technique likely captured the vast majority of responses.
Variables
Some characteristics of the posts were provided by the API, while others were the result of hand coding by our team of human coders.
- Interactions: These were provided by the API. For each post, the Facebook API provides the number of shares, comments and reactions (reactions are a sum of traditional “likes” and Facebook’s more recently added reactions, such as “haha” or “sad”). The Twitter API provides the tweet along with the number of times it has been retweeted. In the analysis of how often each candidates’ posts were retweeted, only those tweets originally sent by the candidates themselves were included.
- Links: All links were extracted from post metadata or from the text of the post itself. Twitter reports all links in each tweet in its metadata, but Facebook only reports the primary link (the link for which a preview becomes embedded in the post), and does not report any other links included in the text. There were a very small number of posts in which this occurred; for these, we did a regular expression search for any additional links.
- Additionally, many of the posted links were shortened versions of the links. In some instances, the platform expanded the link; when it did not, researchers used a script to automatically expand the link. This script simulated repeated calls to the link shortening service until it arrived at the final destination. For example, a link like pewrsr.ch/29qHL48 would expand to a link to a report on Pew Research Center’s website (e.g. http://pewresearch.org/…).
- After all links were fully expanded, they were aggregated to the domain level (e.g. pewresearch.org) and coded by human coders.
- Retweets: All retweets that the candidates posted were identified and the original user extracted. For Bernie Sanders and Hillary Clinton, Twitter identified the retweet and researchers were able to extract all information about the retweet from the tweet’s metadata. Donald Trump only used the built-in retweet functionality for two tweets during this period, instead opting to retweet manually (i.e. by copying and pasting the text of another user’s tweet directly into a new post, and adding the username of the person being retweeted). Researchers identified the pattern for his retweets and built a script that searched through the texts of his tweets using the regular expression ‘^”@(S*):’ (not including single quotes). Both these manual retweets and built-in retweets were counted for Trump.
- For both kinds of retweets, the original Twitter user was extracted and coded by human coders (see below).
- Facebook shares: Researchers manually looked for all Facebook posts that had been shared.
- @-mentions: On both Twitter and Facebook, users can include a link to another user in the text of their message using each service’s built-in functionality – @-mentioning on Twitter, mentioning or tagging on Facebook. These were extracted from the metadata as well. The Twitter API includes the retweeted user for retweeted tweets in the @-mentions section of the metadata; these were excluded for both manual retweets and built-in retweets.
- All mentioned users were coded by human coders (see below).
- Candidate co-mentions: The number of posts in which the candidate mentioned one of the other two candidates (with and without links to the other’s account) were calculated using keyword searches for all variations of the candidates’ names on all posts and tweets.
- Language: Post language was determined by langdetect, a port of Google’s language detection algorithm, and all non-English posts were hand-checked.
- Videos: Researchers counted Twitter and Facebook videos by hand.
Human coding
Researchers developed and tested a codebook (modeled on the codebook used in the 2012 study) to classify links, mentions of other individuals or groups, and retweets. A team of three coders later coded the domain from all links, as well as all retweeted and mentioned users. In order to ensure the validity of the codebook, intercoder testing was conducted on both links and mentioned and retweeted users (retweeted and mentioned users used the same coding scheme). Three human coders coded 25 randomly sampled links and 25 randomly sampled Twitter users (both retweeted and mentioned users); two human coders coded 41 Facebook user mentions. When coding links, the coders achieved a Fleiss’ kappa (a variant of Cohen’s kappa allowing for multiple coders) of 1. For retweeted and mentioned users on Twitter, the coders achieved a Fleiss’ kappa of 0.96. For mentioned users on Facebook, the coders achieved a Cohen’s kappa of 0.91, and the discrepancies between the coders were resolved by researchers.
Survey Methodology
The American Trends Panel (ATP), created by Pew Research Center, is a nationally representative panel of randomly selected U.S. adults living in households. Respondents who self-identify as internet users and who provided an email address participate in the panel via monthly self-administered web surveys, and those who do not use the internet or decline to provide an email address participate via the mail. The panel is being managed by Abt SRBI.
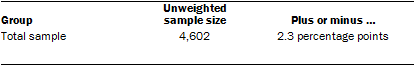
Data in this analysis are drawn from the June wave of the panel, conducted June 7-July 5, 2016, among 4,602 respondents (4,172 by web and 430 by mail). The margin of sampling error for the full sample of 4,602 respondents is plus or minus 2.3 percentage points.
Participating panelists provided either a mailing address or an email address to which a welcome packet, a monetary incentive and future survey invitations could be sent. Panelists also receive a small monetary incentive after participating in each wave of the survey.
The ATP data were weighted in a multi-step process that begins with a base weight incorporating the respondents’ original survey selection probability and the fact that in 2014 some panelists were subsampled for invitation to the panel. Next, an adjustment was made for the fact that the propensity to join the panel and remain an active panelist varied across different groups in the sample. The final step in the weighting uses an iterative technique that matches gender, age, education, race, Hispanic origin and region to parameters from the U.S. Census Bureau’s 2014 American Community Survey. Population density is weighted to match the 2010 U.S. Decennial Census. Telephone service is weighted to estimates of telephone coverage for 2016 that were projected from the July-December 2015 National Health Interview Survey. Volunteerism is weighted to match the 2013 Current Population Survey Volunteer Supplement. It also adjusts for party affiliation using an average of the three most recent Pew Research Center general public telephone surveys. Internet access is adjusted using a measure from the 2015 Survey on Government. Frequency of internet use is weighted to an estimate of daily internet use projected to 2016 from the 2013 Current Population Survey Computer and Internet Use Supplement. Sampling errors and statistical tests of significance take into account the effect of weighting. Interviews are conducted in both English and Spanish, but the Hispanic sample in the American Trends Panel is predominantly native born and English speaking.
The following table shows the unweighted sample sizes and the error attributable to sampling that would be expected at the 95% level of confidence for different groups in the survey:
Sample sizes and sampling errors for other subgroups are available upon request.
In addition to sampling error, one should bear in mind that question wording and practical difficulties in conducting surveys can introduce error or bias into the findings of opinion polls.
The web component of the June wave had a response rate of 82% (4,172 responses among 5,071 web-based individuals in the panel); the mail component had a response rate of 75% (430 responses among 574 non-web individuals in the panel). Taking account of the combined, weighted response rate for the recruitment surveys (10.0%) and attrition from panel members who were removed at their request or for inactivity, the cumulative response rate for the June ATP wave is 2.9%.14
