The 2002 National Survey of Latinos provides both general demographic data on the Latino population as well as attitudinal information on such issues as identity, discrimination, incorporation into the mainstream of society, and experience with the health care and financial systems. While the 2002 NSL sampled only adults and focused on the attitudes and experiences of Hispanics in the United States, in terms of age, household size, household income, and educational attainment, the picture that emerged from the 2002 NSL coincided with Census 2000 results, showing that SOR Hispanics where younger and occupied a more tenuous socio-economic position than did white Hispanics. The following section details the dimensions on which, these somewhat distinct groups, SOR Hispanics and white Hispanics differed in the survey data.9
On Identifying as American
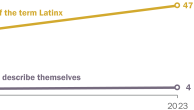
To the extent that identity conveys a sense of belonging, results from the 2002 NSL show that SOR Hispanics seem to experience a greater duality in their identity than their white Hispanic counterparts. When asked which descriptors they used first to describe themselves—country of origin, Hispanic/Latino, or American—foreign-born SOR Hispanics did not differ from white Hispanics.10 Over two-thirds of both groups reported that they identified first with their country of origin. On the other hand, when the same question was asked of native-born Hispanics, among white Hispanics over half (55 percent) reported that they identified first as an American. For SOR Hispanics a significantly smaller share (36 percent) responded that they identified first as an American.
For example, with regard to the future of their children, the only question that yielded differences between white and SOR Hispanics was one that asked “are you confident that your children will have the same moral values as you?” Overall, nearly 30 percent of SOR Hispanics were very confident that their children would share their moral values, while only 22 percent of white Hispanic expressed the same level of confidence. When nativity was introduced as a factor, there was no difference between foreign-born SOR Hispanics and foreign-born white Hispanics rather differences between native-born SOR Hispanics and native-born white Hispanics drove the overall difference. Native-born SOR Hispanic adults in this instance expressed more confidence in their moral sway over their children.11
Views on the Government of the United States and Political Participation
When asked how much of the time they trust the government in Washington to do what is right, SOR Hispanics did not differ significantly from white Hispanics, this was true both when the sample was limited to the foreign-born or to the native-born. Generally about 29 percent of Hispanics answered “most of the time”, while about 47 percent answered “some of the time.” While SOR and white Hispanics expressed similar levels of trust, when asked if based on their experience, political leaders are interested in the problems of particular concern to Hispanics living here, the responses diverged by race. Foreign-born white Hispanics were more likely (46 percent) than foreign-born SOR Hispanics (39 percent) to answer yes, that political leaders were concerned. Among the native-born SOR Hispanics (59 percent) were more likely to say no, that political leaders were not concerned than were white Hispanics (51 percent).
The 2002 NSL also provides data on why white Hispanics might feel more politically enfranchised than SOR Hispanics. For example, among the native-born, only 67 percent of SOR Hispanics reported that they were registered voters, while a significantly larger share of white Hispanics (85 percent) reported that they were registered voters. Here again, even when divided into second versus third and higher generations, race was significant. In the second generation 66 percent of SOR Hispanics versus 90 percent of white Hispanics reported that they were registered voters. And in the third and higher group among SOR Hispanics 65 percent reported that they were registered to vote, while among white Hispanics a significantly greater share (83 percent) answered that they were registered voters. Similarly, differences on reported voting behavior were also significant and displayed the same qualitative pattern.
For the foreign-born, the share of citizens among SOR Hispanics (30 percent) and white Hispanics (34 percent) was not significantly different. However, relative to SOR Hispanics more white Hispanics reported that they were registered to vote (89 percent) and had ever voted (81 percent) in a U.S. election. Among SOR Hispanics 79 percent reported that they were registered voters and 66 percent reported that they had ever voted.
When asked whether they considered themselves Republicans, Democrats, Independents or something else, a greater share of white Hispanics identified themselves as Republicans…
When asked whether they considered themselves Republicans, Democrats, Independents or something else, a greater share of white Hispanics identified themselves as Republicans and this held for both native- and foreign-born respondents.12 Among native-born SOR Hispanics only 13 percent reported that they were Republican, while among native-born white Hispanics 22 percent reported that they were Republican. About 12 percent of foreign-born SOR Hispanics and 21 percent of white Hispanics reported that they were Republican.
Views on Discrimination toward Hispanics
With regard to their views about discrimination, nativity seems to supercede race for the foreignborn. About half of both white and SOR Hispanic immigrants view discrimination as a major problem, in schools, in the work place, and view discrimination as a barrier to success in the United States. On the other hand, within the native-born Hispanic population views of discrimination diverge between white Hispanics and SOR Hispanics. For example, more native-born SOR Hispanics (30 percent) report that discrimination against Hispanics is a major problem in schools. Only 22 percent of native-born white Hispanics report the same about schools. Likewise, 35 percent of native-born SOR Hispanics report that discrimination is a major problem in the workplace, whereas only 22 percent of white Hispanics report discrimination as a major workplace problem. Similarly, one-quarter of native-born white Hispanics reported that discrimination was a major problem preventing Hispanics from succeeding in America, while over one-third of native-born SOR Hispanics felt that discrimination was an obstacle to success in America.
When asked how often particular incidents of discriminatory treatment had befallen them, nativeborn white Hispanics were significantly more likely to answer never. For example, 68 percent of native-born white Hispanics reported that they had never been treated with less respect than other people, 73 percent that they had never received poorer service than other people at stores or restaurants, and 77 percent had never been called names or insulted because of their ethnic or racial background. In response to the same list of incidents, native-born SOR Hispanics were less likely to have answered never. In the same order presented above, 51 percent, 56 percent and 66 percent of SOR Hispanics answered never. Dividing the native-born into second and third and higher generations did not eliminate the significant effect of race on the answers reported for these questions. Among the native-born, the second generation reported experiencing more discrimination than the third and higher generation.