The American Trends Panel (ATP), created by Pew Research Center, is a nationally representative panel of randomly selected U.S. adults. Panelists participate via self-administered web surveys. Panelists who do not have internet access at home are provided with a tablet and wireless internet connection. The panel is being managed by Ipsos.
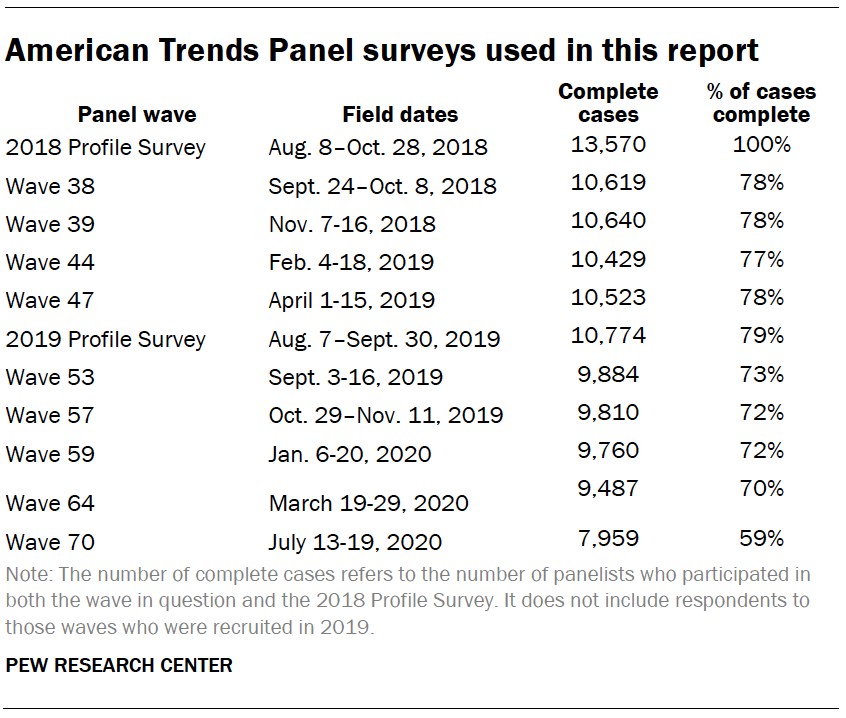
The data in this report comes from a longitudinal dataset comprised of the 13,570 ATP members who completed the panel’s 2018 annual profile survey. In particular, it focuses on the 11,077 of these panelists who indicated they were registered to vote.
Panelists who were newly recruited in 2018 and those who joined prior to 2018 were profiled separately. Of the 13,570 in total, 4,792 were preexisting members who joined the panel prior to 2018. The profile survey for preexisting panelists was conducted from Aug. 20 to Oct. 28, 2018, and had a response rate of 88%. The cumulative response rate accounting for nonresponse to the recruitment surveys was 2.5%.
The remaining 8,778 panelists were newly recruited in 2018. These panelists were both profiled and invited to join the panel in a survey fielded between Aug. 8 and Oct. 31, 2018. This survey employed an address-based sample (ABS). Respondents were sent a survey invitation via mail and instructed to go online to complete the survey. This survey had a response rate of 11.7%. Although a total of 9,396 individuals completed this survey, only the 8,778 who agreed to join the ATP are included in this analysis.
For these 13,570 panelists, their 2018 profile data was combined with their answers to questions asked on 10 subsequent surveys conducted up through August 2020. On average, panelists who completed the 2018 profile survey responded to seven of the 10 follow-up surveys. Only about 41% of the panelists in this dataset responded to all 10.
There is some evidence that those who are most likely to participate consistently in the panel are more interested and knowledgeable about politics than those who only periodically respond. Omitting the individuals who did not participate in every wave of the survey might overstate the amount of stability in individuals’ partisanship.
Rather than rely only on data from panelists with perfect survey participation, this analysis uses a technique known as multiple imputation which uses statistical models to fill in missing values for panelists who did not respond to a given wave. The particular missing data imputation algorithm we used is a method known as multiple imputation by chained equations, or MICE. The MICE algorithm is designed for situations where there are several variables with missing data that need to be imputed at the same time. MICE takes the full survey dataset and iteratively fills in missing data for each question using a statistical model that more closely approximates the overall distribution with each iteration. The process is repeated many times until the distribution of imputed data no longer changes. Although many kinds of statistical models can be used with MICE, this project used a machine learning method called classification and regression trees (CART).1
The American Trends Panel survey methodology
The ATP was created in 2014, with the first cohort of panelists invited to join the panel at the end of a large, national, landline and cellphone random-digit-dial survey that was conducted in both English and Spanish. Two additional recruitments were conducted using the same method in 2015 and 2017, respectively. Across these three surveys, a total of 19,718 adults were invited to join the ATP, of whom 9,942 agreed to participate.
In August 2018, the ATP switched from telephone to address-based recruitment. Invitations were sent to a random, address-based sample (ABS) of households selected from the U.S. Postal Service’s Delivery Sequence File. In each household, the adult with the next birthday was asked to go online to complete a survey, at the end of which they were invited to join the panel. For a random half-sample of invitations, households without internet access were instructed to return a postcard. These households were contacted by telephone and sent a tablet if they agreed to participate. A total of 9,396 were invited to join the panel, and 8,778 agreed to join the panel and completed an initial profile survey. The same recruitment procedure was carried out on August 19, 2019, from which a total of 5,900 were invited to join the panel and 4,720 agreed to join the panel and completed an initial profile survey (although it should be noted that no data from panelists recruited in 2019 was used in this report). Of the 23,440 individuals who have ever joined the ATP, 15,410 remained active panelists and continued to receive survey invitations at the time the most recent survey in this analysis was conducted.
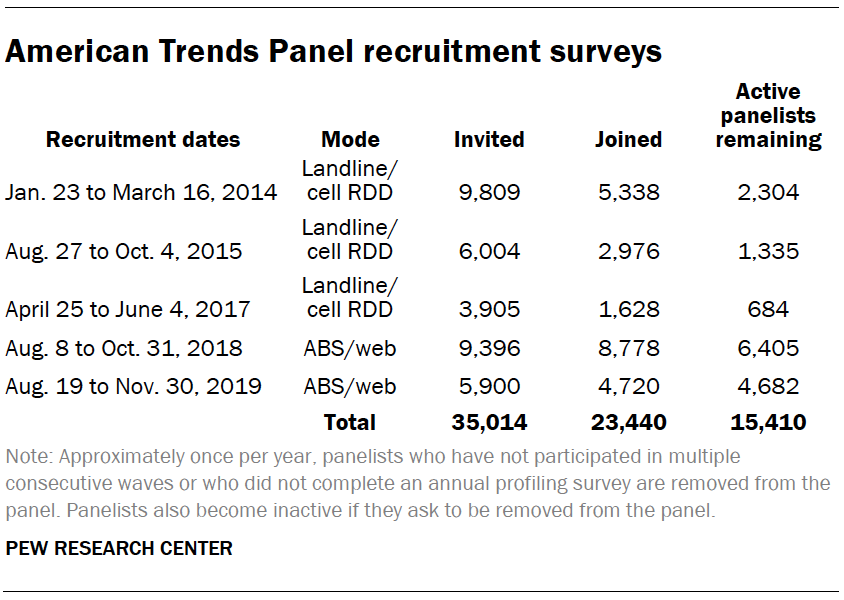
The U.S. Postal Service’s Delivery Sequence File has been estimated to cover as much as 98% of the population, although some studies suggest that the coverage could be in the low 90% range.2 The American Trends Panel never uses breakout routers or chains that direct respondents to additional surveys.
Weighting
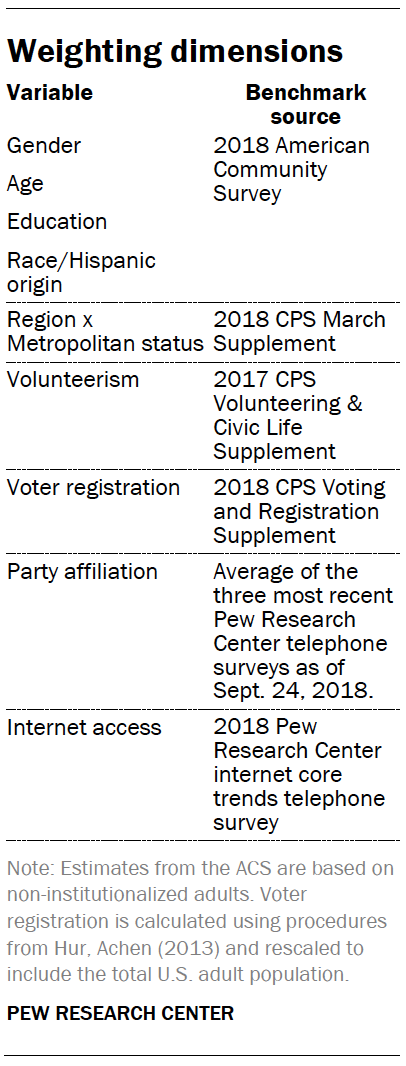
The ATP data was weighted in a multistep process that begins with a base weight incorporating the respondents’ original selection probability. The next step in the weighting uses an iterative technique that aligns the sample to population benchmarks on the dimensions listed in the accompanying table.
The use of multiple imputation means that it is not possible to reliably report a single margin of sampling error for the sample as a whole or for particular subgroups. The variability of multiply imputed estimates differs substantially from question to question, and questions asked on later waves with larger amounts of missing data can have much more variability than earlier waves.
Sampling errors and test of statistical significance take into account both the effect of weighting and the imputation of missing data. Interviews are conducted in both English and Spanish.
In addition to sampling error, one should bear in mind that question wording and practical difficulties in conducting surveys can introduce error or bias into the findings of opinion polls.
© Pew Research Center, 2020


