In this report, we explored factors related to whether people thought an increasing number of people of many different races, ethnic groups and nationalities made their country a better place to live. To do this, we performed bivariate and multiple regression analyses predicting attitudes toward increasing diversity as a function of people’s attitudes on certain economic, political and social issues in their country, as well as their demographic characteristics. Specifically, we used R’s survey package for fitting generalized linear models with complex survey designs to estimate a weighted linear model with fixed effects and robust standard errors. We evaluated the robustness of the results by including a dummy variable for each country separately in the model.
Model A: Views of migrants and refugees & diversity
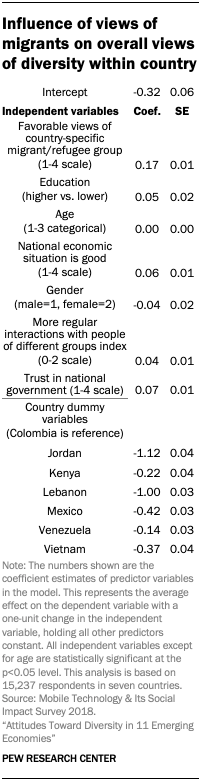
In our first model, views of increasing diversity is the dependent variable, which we have re-centered so that -1 means a person thinks increasing diversity makes their country a worse place to live, 1 means they think it makes their country better, and 0 indicates an opinion that it doesn’t make a difference either way. The independent, or predictor, variables include evaluations of the respondent’s economic situation; trust in the national government; a scale of how often they interact with people of other groups; their age, gender, education; and a dummy variable for each of the countries in the model. This model tests whether attitudes toward specific migrant groups are related to more general views of diversity, showing whether abstract views about diversity are related to particular groups that a diverse country might include. Because questions about favorable views of country-specific migrant or refugee groups were not asked in all 11 countries, this model only contains data from the seven countries where the questions were fielded.
The interaction scale is a combined variable of two different questions: how often respondents interact with people from different religious groups and how often they do so with different racial or ethnic groups. Respondents who reported at least occasional interactions with both different religious groups and different ethnic groups are coded as 2; occasional interaction with one of those groups but not the other is coded as 1. And those who say they rarely or never interact with neither people of different religious groups nor different ethnic or racial groups are coded as 0. People needed to answer both questions to be included in the model.
Overall, we find that positive views of migrants and refugees have a strong association with individual positivity toward diversity. Put another way, we find that attitudes toward specific immigrant and migrant groups are related to overall views of whether diversity is good for society. Holding other factors constant, a one-unit increase in favorable views of migrants/refugees results in an increasingly positive view of diversity by 0.17 units, and a one-unit increase in trust in the national government coincides with a 0.07-unit increase in having a positive view of diversity in one’s country. All of the variables except for age included in the model are significant at the 95% confidence level.
Model B: Interacting with other groups and diversity
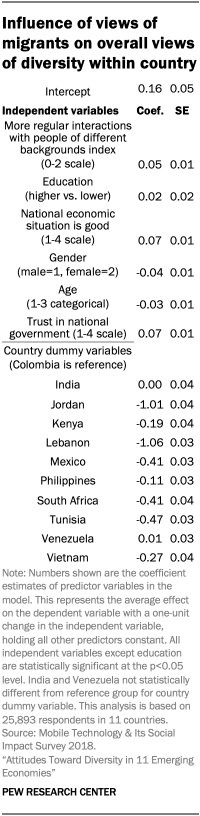
We ran a second model to examine the relationship between how often an individual interacts with someone of a different group and views of diversity in their country. This model is similar to Model A but does not include country-specific questions about migrants and refugees. Model B includes all 11 countries where the survey was fielded.
Again, attitudes of increasing diversity is the dependent variable. We wanted to know if interacting with people who are different than you plays a role in how you think about diversity in your country, so we created a scale. The interaction scale is a combined variable of two different questions: how often respondents interact with people from different religious groups, and how often they do so with different racial or ethnic groups. Take religion, for example. If the respondent claimed to occasionally or frequently interact with someone who is not from the respondent’s religious group, they receive 1 point on the interaction scale; if not, they get 0. We repeated that for racial/ethnic groups and added the values, resulting in 0-2 scale where 0 indicates the respondent never interacts with someone from a different group.
Overall, we find that more interactions with other groups has a strong association with individual positivity toward diversity. Holding other factors constant, a one-unit increase in interactions results in an increasingly positive view of diversity by 0.05 units. In addition to interacting with other groups, a one-unit increase in trust in the national government are 0.07 units more likely to say an increasing number of people of many different races, ethnic groups and nationalities makes their country a better place to live when all other variables are held constant. Likewise, a one-unit increase in thinking the national economy is doing well corresponds to 0.07 units more positivity about diversity in the country.
Jordan and Lebanon are the most negative toward diversity. Compared with someone in Colombia, the reference country, a respondent in Lebanon or Jordan has a baseline view of diversity approximately one unit lower, respectively.