
Note: For our more recent in-depth analysis of the middle class, read “The State of the American Middle Class” (May 2024).
The middle class, once the economic stratum of a clear majority of American adults, has steadily contracted in the past five decades. The share of adults who live in middle-class households fell from 61% in 1971 to 50% in 2021, according to a new Pew Research Center analysis of government data.
From 2020: Are you in the American middle class? Find out with our income calculator
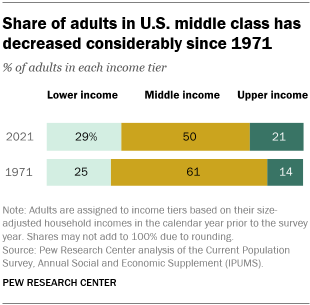
The shrinking of the middle class has been accompanied by an increase in the share of adults in the upper-income tier – from 14% in 1971 to 21% in 2021 – as well as an increase in the share who are in the lower-income tier, from 25% to 29%. These changes have occurred gradually, as the share of adults in the middle class decreased in each decade from 1971 to 2011, but then held steady through 2021.
The analysis below presents seven facts about how the economic status of the U.S. middle class and that of America’s major demographic groups have changed since 1971. A related analysis examines the impact of the coronavirus pandemic on the financial well-being of households in the lower-, middle- and upper-income tiers, with comparisons to the Great Recession era. (In the source data for both analyses, demographic figures refer to the 1971-2021 period, while income figures refer to the 1970-2020 period. Thus, the shares of adults in an income tier are based on their household incomes in the previous year.)
This report analyzes data from the Annual Social and Economic Supplements (ASEC) of the Current Population Survey (CPS) to study how the economic status of the American middle class has changed since 1971. It also examines the movement of demographic groups in and out of the American middle class and across lower- and upper-income tiers from 1971 to 2021.
The CPS is the U.S. government’s official source for monthly estimates of unemployment; the ASEC, conducted in March each year, is the official source for its estimates of income and poverty. The COVID-19 outbreak has affected data collection efforts by the U.S. government in its surveys, limiting in-person data collection and affecting the response rate. It is possible that some measures of economic outcomes and how they vary across demographic groups are affected by these changes in data collection. This report makes use of updated weights released by the Census Bureau to correct for nonresponse in 2019, 2020 and 2021.
In this analysis, “middle-income” adults in 2021 are those with an annual household income that was two-thirds to double the national median income in 2020, after incomes have been adjusted for household size, or about $52,000 to $156,000 annually in 2020 dollars for a household of three. “Lower-income” adults have household incomes less than $52,000 and “upper-income” adults have household incomes greater than $156,000.
The income it takes to be middle income varies by household size, with smaller households requiring less to support the same lifestyle as larger households. The boundaries of the income tiers also vary across years with changes in the national median income. Read the methodology for more details.
The terms “middle income” and “middle class” are used interchangeably in this analysis for the sake of exposition. But being middle class can refer to more than just income, be it the level of education, the type of profession, economic security, home ownership, or one’s social and political values. Class also could simply be a matter of self-identification.
Household incomes have risen considerably since 1970, but those of middle-class households have not climbed nearly as much as those of upper-income households. The median income of middle-class households in 2020 was 50% greater than in 1970 ($90,131 vs. $59,934), as measured in 2020 dollars. These gains were realized slowly, but for the most part steadily, with the exception of the period from 2000 to 2010, the so-called “lost decade,” when incomes fell across the board.
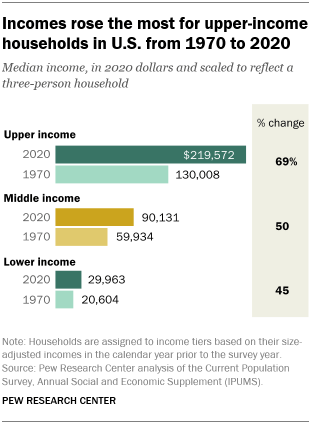
The median income for lower-income households grew more slowly than that of middle-class households, increasing from $20,604 in 1970 to $29,963 in 2020, or 45%.
The rise in income from 1970 to 2020 was steepest for upper-income households. Their median income increased 69% during that timespan, from $130,008 to $219,572.
As a result of these changes, the gap in the incomes of upper-income and other households also increased. In 2020, the median income of upper-income households was 7.3 times that of lower-income households, up from 6.3 in 1970. The median income of upper-income households was 2.4 times that of middle-income households in 2020, up from 2.2 in 1970.
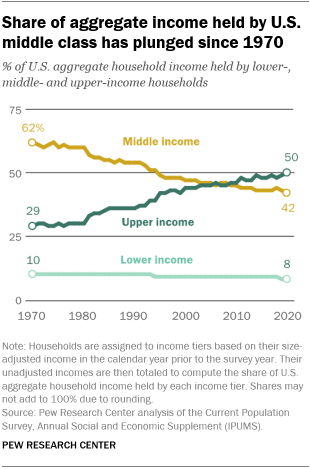
The share of aggregate U.S. household income held by the middle class has fallen steadily since 1970. The widening of the income gap and the shrinking of the middle class has led to a steady decrease in the share of U.S. aggregate income held by middle-class households. In 1970, adults in middle-income households accounted for 62% of aggregate income, a share that fell to 42% in 2020.
Meanwhile, the share of aggregate income accounted for by upper-income households has increased steadily, from 29% in 1970 to 50% in 2020. Part of this increase reflects the rising share of adults who are in the upper-income tier.
The share of U.S. aggregate income held by lower-income households edged down from 10% to 8% over these five decades, even though the proportion of adults living in lower-income households increased over this period.
Older Americans and Black adults made the greatest progress up the income ladder from 1971 to 2021. Among adults overall, the share who were in the upper-income tier increased from 14% in 1971 to 21% in 2021, or by 7 percentage points. Meanwhile, the share in the lower-income tier increased from 25% to 29%, or by 4 points. On balance, this represented a net gain of 3 percentage points in income status for all adults.
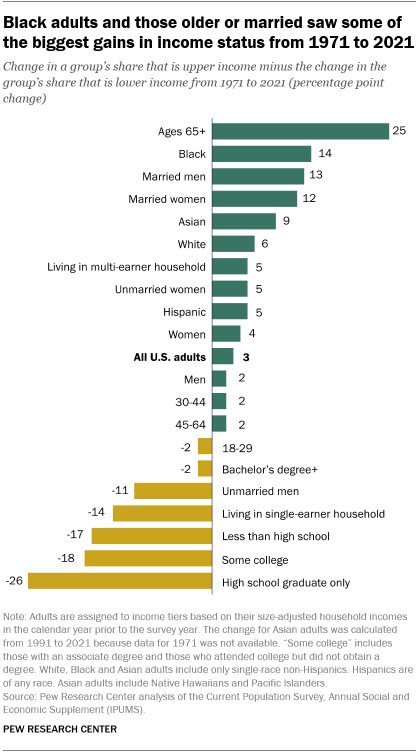
Those ages 65 and older made the most notable progress up the income ladder from 1971 to 2021. They increased their share in the upper-income tier while reducing their share in the lower-income tier, resulting in a net gain of 25 points. Progress among adults 65 and older was likely driven by an increase in labor force participation, rising educational levels and by the role of Social Security payments in reducing poverty.
Black adults, as well as married men and women, were also among the biggest gainers from 1971 to 2021, with net increases ranging from 12 to 14 percentage points.
On the other hand, not having at least a bachelor’s degree resulted in a notable degree of economic regression over this period. Adults with a high school diploma or less education, as well as those with some college experience but no degree, saw sizable increases in their shares in the lower-income tier in the past five decades. Although no single group of adults by education category moved up the income ladder from 1971 to 2021, adults overall realized gains by boosting their education levels. The share of adults 25 and older who had completed at least four years of college stood at 38% in 2021, compared with only 11% in 1971.
Progress up the income ladder for a demographic group does not necessarily signal its economic status in comparison with other groups at a given point in time. For example, in 2021, adults ages 65 and older and Black adults were still more likely than many other groups to be lower income, and less likely to be middle or upper income.
Married adults and those in multi-earner households made more progress up the income ladder from 1971 to 2021 than their immediate counterparts. Generally, partnered adults have better outcomes on a range of economic outcomes than the unpartnered. One reason is that marriage is increasingly linked to educational attainment, which bears fruit in terms of higher incomes.
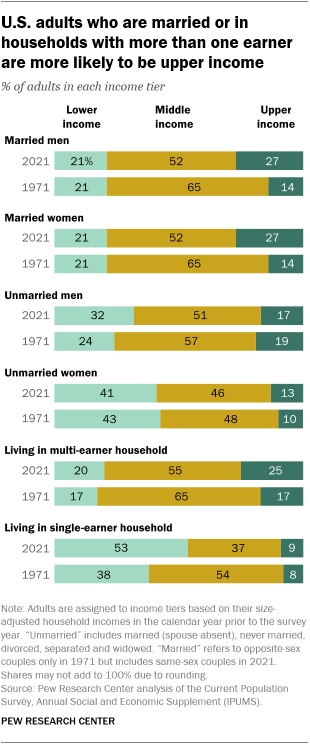
Married men and women were distributed across the income tiers identically to each other in both 1971 and 2021. Both groups nearly doubled their shares in the upper-income tier in the past five decades, from 14% in 1971 to 27% in 2021. And neither group experienced an increase in the share in the lower-income tier.
Unmarried men and women were much more likely than their married counterparts to be in the lower-income tier in 2021. And unmarried men, in particular, experienced a sizable increase in their share in the lower-income tier from 1971 t0 2021 and a similarly large decrease in their share in the middle-income tier. Nonetheless, unmarried men are less likely than unmarried women to be lower income and more likely to be middle income.
Adults in households with more than one earner fare much better economically than adults in households with only one earner. In 2021, some 20% of adults in multi-earner households were in the lower-income tier, compared with 53% of adults in single-earner households. Also, adults in multi-earner households were more than twice as likely as adults in single-earner households to be in the upper-income tier in 2021. In the long haul, adults in single-earner households are among the groups who slid down the income ladder the most from 1971 to 2021.

Despite progress, Black and Hispanic adults trail behind other groups in their economic status. Although Black adults made some of the biggest strides up the income tiers from 1971 to 2021, they, along with Hispanic adults, are more likely to be in the lower-income tier than are White or Asian adults. About 40% of both Black and Hispanic adults were lower income in 2021, compared with 24% of White adults and 22% of Asian adults.
Black adults are the only major racial and ethnic group that did not experience a decrease in its middle-class share, which stood at 47% in 2021, about the same as in 1971. White adults are the only group in which more than half (52%) lived in middle-class households in 2021, albeit after declining from 63% in 1971. At the top end, only about one-in-ten Black and Hispanic adults were upper income in 2021, compared with one-in-four or more White and Asian adults.
The relative economic status of men and women has changed little from 1971 to 2021. Both experienced similar percentage point increases in the shares in the lower- and upper-income tiers, and both saw double-digit decreases in the shares who are middle class. Women remained more likely than men to live in lower-income households in 2021 (31% vs. 26%).
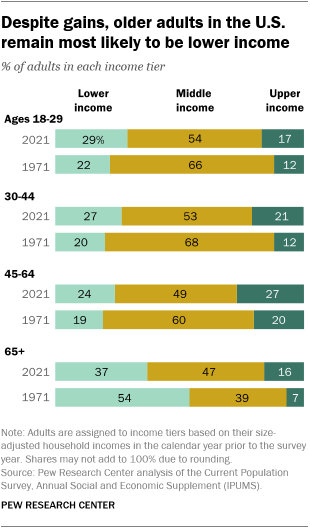
Adults 65 and older continue to lag economically, despite decades of progress. The share of adults ages 65 and older in the lower-income tier fell from 54% in 1971 to 37% in 2021. Their share in the middle class rose from 39% to 47% and their share in the upper-income tier increased from 7% to 16%. However, adults 65 and older are the only age group in which more than one-in-three adults are in lower-income households, and they are much less likely than adults ages 30 to 44 – as well as those ages 45 to 64 – to be in the upper-income tier.
All other age groups experienced an increase in the shares who are lower income from 1971 to 2021, as well as a decrease in the shares who are middle income. But they also saw increases in the shares who are upper income. Among adults ages 30 to 44, for instance, the share in upper-income households almost doubled, from 12% in 1971 to 21% in 2021.
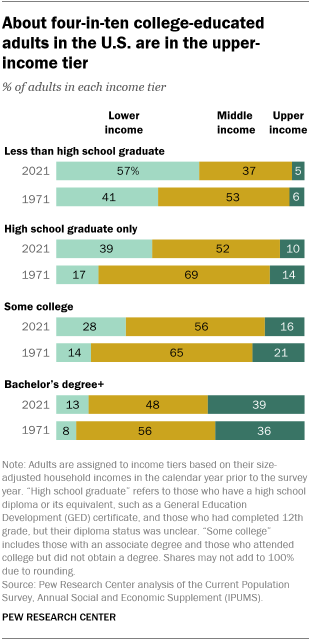
There is a sizable and growing income gap between adults with a bachelor’s degree and those with lower levels of education. In 2021, about four-in-ten adults with at least a bachelor’s degree (39%) were in the upper-income tier, compared with 16% or less among those without a bachelor’s degree. The share of adults in the upper-income tier with at least a bachelor’s degree edged up from 1971 to 2021, while the share without a bachelor’s degree either edged down or held constant.
About half or a little more of adults with either some college education or a high school diploma only were in the middle class in 2021. But these two groups, along with those with less than a high school education, experienced notable drops in their middle class shares from 1971 to 2021 – and notable increases in the shares in the lower-income tier. In 2021, about four-in-ten adults with only a high school diploma or its equivalent (39%) were in the lower-income tier, about double the share in 1971.
Note: Here is the methodology for this analysis.
