
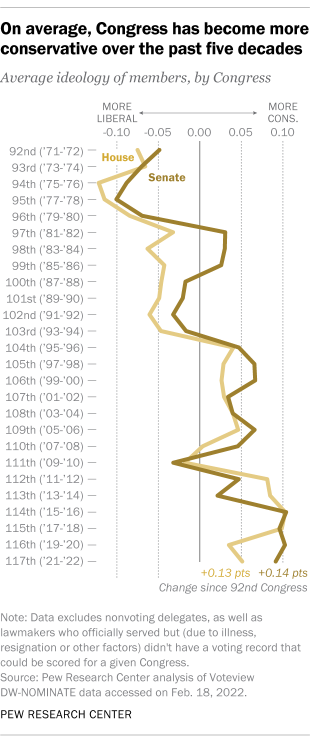
It’s become commonplace among observers of U.S. politics to decry partisan polarization in Congress. Indeed, a Pew Research Center analysis finds that, on average, Democrats and Republicans are farther apart ideologically today than at any time in the past 50 years.
But the dynamics behind today’s congressional polarization have been long in the making. The analysis of members’ ideological scores finds that the current standoff between Democrats and Republicans is the result of several overlapping trends that have been playing themselves out – and sometimes reinforcing each other – for decades.
- Both parties have grown more ideologically cohesive. There are now only about two dozen moderate Democrats and Republicans left on Capitol Hill, versus more than 160 in 1971-72.
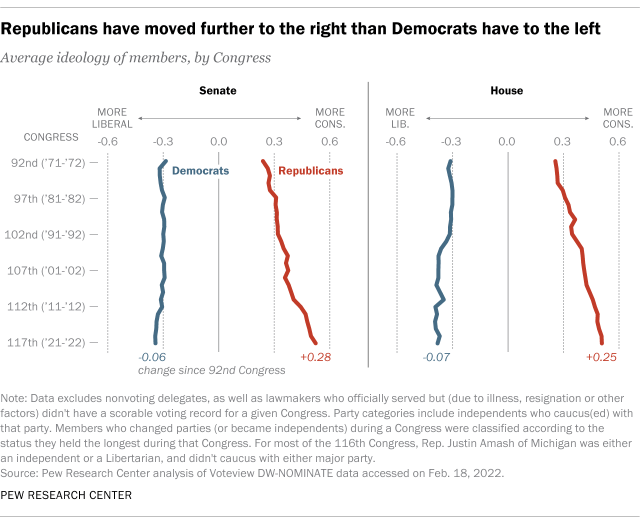
- Both parties have moved further away from the ideological center since the early 1970s. Democrats on average have become somewhat more liberal, while Republicans on average have become much more conservative.
- The geographic and demographic makeup of both congressional parties has changed dramatically. Nearly half of House Republicans now come from Southern states, while nearly half of House Democrats are Black, Hispanic or Asian/Pacific Islander.
The Center’s analysis is based on DW-NOMINATE, a method that uses lawmakers’ roll-call votes to place them in a two-dimensional ideological space. It is designed to produce scores that are comparable across time. This analysis focuses on the first dimension, which is essentially the economic and governmental aspects of the familiar left-right spectrum and ranges from 1 (most conservative) to -1 (most liberal). (For more details on DW-NOMINATE and this analysis’ geographical definitions, read “How we did this.”)
This analysis is based on DW-NOMINATE, a method of scaling lawmakers’ ideological positions based on their roll-call votes. It is the latest iteration of a procedure first developed by political scientists Keith T. Poole and Howard Rosenthal in the early 1980s.
DW-NOMINATE places each lawmaker on a two-dimensional scale, much like a standard x-y graph. The first (“horizontal”) dimension is essentially the same as the economic and governmental aspects of the familiar left-liberal/right-conservative political spectrum. The second (“vertical”) dimension typically picks up crosscutting issues that have divided the major parties at various times in American history, such as slavery, currency policy, immigration, civil rights and abortion. But as Poole noted in 2017, since about 2000 that second dimension has faded in significance, to the point where congressional activity has “collapse[d] into a one-dimensional, near-parliamentary voting structure … almost every issue is voted along ‘liberal-conservative’ … lines.”
Accordingly, like most political science work that employs DW-NOMINATE scores, this analysis focuses on the primary liberal/conservative scale. That scale runs from -1 (most liberal) to 1 (most conservative). Each lawmaker is assigned a value between those endpoints based on their voting record; the scores are designed to be comparable between Congresses and across time.
In mid-February 2022, we downloaded DW-NOMINATE data for all senators and representatives from the 92nd Congress (1971-72) to the current 117th Congress. We excluded nonvoting delegates from the analysis, as well as lawmakers who officially served but (due to health issues, resignation or other factors) didn’t have a voting record that could be analyzed and scored for a given Congress. We did include all other lawmakers who served at any time during a given Congress, including those who died mid-term; those appointed to temporarily fill Senate seats who only served for part of a term; and those who left Congress early to fill some other office, such as a Cabinet position. (We also included all House speakers, even if they didn’t have an analyzable voting record. For many years, the tradition in the House has been for speakers to vote only on very significant matters or if their vote will be decisive.)
Lawmakers who changed parties in mid-Congress were classified by whichever label they wore for the longest time. Independents were analyzed as part of whichever major party they caucused with, with the exception of Rep. Justin Amash of Michigan during the 116th Congress. (Amash left the Republican Party in mid-2019, and for most of his final term did not caucus with either major party.)
In our discussion of “Southern Democrats” and “Southern Republicans,” we defined “the South” as the 11 states that comprised the Confederacy during the Civil War, most of which were dominated politically by Democrats for generations after Reconstruction ended. Southern Democrats, however, were ideologically and demographically quite distinct from Democrats in the rest of the country, so they merited separate study (and we wanted to see if today’s Southern Republicans are similarly distinctive). We chose to use the former Confederate states as our definition of “the South,” as the states that made up the so-called “Solid South” varied somewhat over time and we wanted a consistent, relatively objective definition.
Our analysis of the changing racial and ethnic composition of lawmakers was based on data from the U.S. House of Representatives’ archives.
Between the 92nd Congress of 1971-72 and the current 117th Congress, both parties in both the House and the Senate have shifted further away from the center, but Republicans more so. House Democrats, for example, moved from about -0.31 to -0.38, meaning that over time they’ve become modestly more liberal on average. House Republicans, by contrast, moved from 0.25 to nearly 0.51, a much bigger increase in the conservative direction.
As Democrats have grown more liberal over time and Republicans much more conservative, the “middle” – where moderate-to-liberal Republicans could sometimes find common ground with moderate-to-conservative Democrats on contentious issues – has vanished.
Five decades ago, 144 House Republicans were less conservative than the most conservative Democrat, and 52 House Democrats were less liberal than the most liberal Republican, according to the analysis. But that zone of ideological overlap began to shrink, as conservative Democrats and liberal Republicans – increasingly out of step with their caucuses and their constituents – either retired, lost reelection bids or, in a few cases, switched parties.
Since 2002, when Republican Rep. Constance Morella of Maryland was defeated for reelection and GOP Rep. Benjamin Gilman of New York retired, there’s been no overlap at all between the least liberal Democrats and the least conservative Republicans in the House. In the Senate, the end of overlap came in 2004, when Democrat Zell Miller of Georgia retired.
Ever since, the gaps between the least conservative Republicans and least liberal Democrats in both the House and Senate have widened – making it ever less likely that there’s any common ground to find.
The ideological shifts in the congressional parties have occurred alongside – and, perhaps to some extent, because of – geographic and demographic shifts in their composition.
In 1971-72, representatives from the 11 former Confederate states made up nearly a third (31.4%) of all the House Democrats who served in that Congress. Those Southern representatives were notably less liberal than Democrats from elsewhere in the country: Their average DW-NOMINATE score was -0.144, versus -0.388 for non-Southern House Democrats.
Over time, though, Southern Democrats became both fewer in number and more liberal – to the point where today, they account for only 22% of the House Democratic caucus, but ideologically are almost indistinguishable from their non-Southern colleagues (average scores of -0.383 and -0.381, respectively).
On the Republican side of the aisle, almost the exact opposite trend has occurred. Southerners made up less than 15% of the House GOP caucus 50 years ago but comprise about 42% of it today. And while Republicans in general have become more conservative, that’s been especially true of Southern Republicans in the House: Their DW-NOMINATE score has moved from about 0.29 (only slightly to the right of non-Southern Republicans) in 1971-72 to 0.57 in the current Congress, versus about 0.46 today for non-Southern House Republicans. (These trends are similar in the Senate, although only four of the 22 senators from former Confederate states are currently Democrats.)
The racial and ethnic makeup of both parties’ Southern lawmakers has changed considerably. In 1971-72, according to House records, only 12 African Americans served in the House and one in the Senate, and none were from the South. Of the five Hispanics in the House, two were from Texas (the lone Hispanic senator was from New Mexico). And the only Asian Americans or Pacific Islanders in Congress were Hawaii’s two senators (one Democrat, one Republican) and two representatives (both Democrats).
In the current Congress, 24 of the 50 House Democrats from the South are African American; seven are Hispanic; and two are Asian Americans or Pacific Islanders. (Rep. Bobby Scott of Virginia is of both African American and Filipino descent.) One of the four Democratic senators from the South (Raphael Warnock of Georgia) is African American. In contrast, only one of the 91 Southern House Republicans is Black (Byron Donalds of Florida); four others are Hispanic. One of the GOP’s 18 Southern senators is Black (Tim Scott of South Carolina) and two are Hispanic (Ted Cruz of Texas and Marco Rubio of Florida).
Note: This is an updated version of a post originally published June 12, 2014.
