
Americans are acutely sensitive to gasoline prices, especially when they’re on the rise. One reason, of course, is that we buy a lot of gas: an estimated 570 gallons this year for the average driver, which at current national average prices would cost close to $2,000. Also, gas prices are posted all over town on large signs – unlike, say, milk prices – and people typically buy gas on its own rather than as part of a larger shopping trip, making price changes more noticeable. And gas prices can and do swing sharply and unpredictably, in ways that can seem unconnected to the rest of the economy.
Regular gas costs, on average, 58.7% more than it did a year ago this time – $3.491 a gallon last month, versus $2.20 in November 2020, according to the federal Energy Information Administration (EIA).
But looking just at the recent rise can be misleading, or at least incomplete. For one thing, a year ago the United States was battling yet another wave of COVID-19 cases, large parts of the economy were still shuttered and demand for gas was way down. Estimated consumption in 2020 was 534 gallons per driver, down 14.4% from 624 gallons in 2019.
Every time gasoline prices spike, people seek explanations and solutions. While the Biden administration has responded to the current runup by urging regulators to investigate oil and gas companies and by releasing 50 million barrels from the Strategic Petroleum Reserve, we wanted to place current conditions in a broader – and longer – perspective.
Our main source for gasoline price data was the U.S. Energy Information Administration (EIA), the statistical arm of the Department of Energy. When looking at long-term price trends, we adjusted prices for inflation using the Consumer Price Index Retroactive Series from the federal Bureau of Labor Statistics; the R-CPI-U-RS, as it’s known, estimates what inflation would have been in prior years if current methods had been in use.
The EIA also provides data on how much gasoline is used in the United States. To estimate full-year consumption for 2021, we calculated the ratio of this year’s consumption through September to the first nine months of 2020, then applied that ratio to 2020’s full-year consumption total.
The Federal Highway Administration compiles data from states on licensed drivers, but its most recent figures are from 2019. To estimate the total number of U.S. licensed drivers in 2020 and 2021, we applied the average growth rate over the previous five years to the 2019 total. We then divided our estimated total gas consumption by the estimated total number of licensed drivers to arrive at an estimate for how much gas the typical driver will use in 2021.
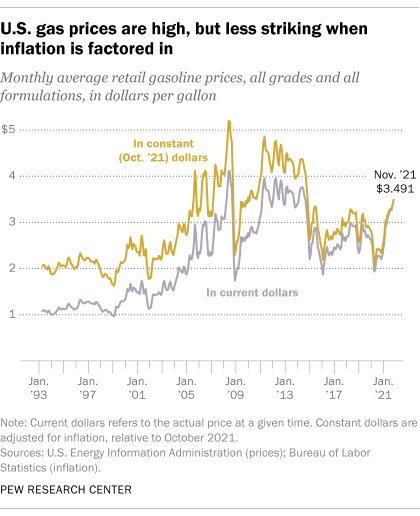
Also, the volatility of gas prices means they can go down as sharply and as suddenly as they go up. In the spring of 2020, as the COVID-19 pandemic sparked widespread lockdowns, the average gas price sank 27% between Feb. 24 and April 27. Since 1994, average gas prices have fluctuated between a low of 96.2 cents a gallon in February 1999 and a high of $4.114 in July 2008. The current average price, in fact, is almost exactly what it was in September 2014 – at least on a nominal basis.
When inflation is factored in, today’s prices appear more modest. In today’s dollars, gas cost an average of $5.20 a gallon in June 2008, and more than $4 as recently as September 2014.
Also, gasoline is not a single, uniform product. Besides regular, midgrade and premium gas, which differ by octane rating, there’s conventional and “reformulated” gas. The latter is required to be sold in California, along the Northeastern seaboard and in several other major urban areas to reduce smog and other air pollutants.
Over the past year, reformulated gas was consistently 30 to 35 cents more expensive than conventional gas until mid-October, when the differential began to widen, according to an analysis of EIA price data – it’s now about 46 cents more expensive. Over the same period, midgrade gas has ranged from 37 cents to 46 cents more expensive than regular, while premium has been 25 to 27 cents higher than midgrade.
Where you buy gas also matters. Much of the U.S. petroleum industry is concentrated along the Gulf Coast, making it perhaps unsurprising that gas tends to be cheapest there. The average price in that region was $3.072 a gallon in late November, and in Texas it was also a hairsbreadth above $3.
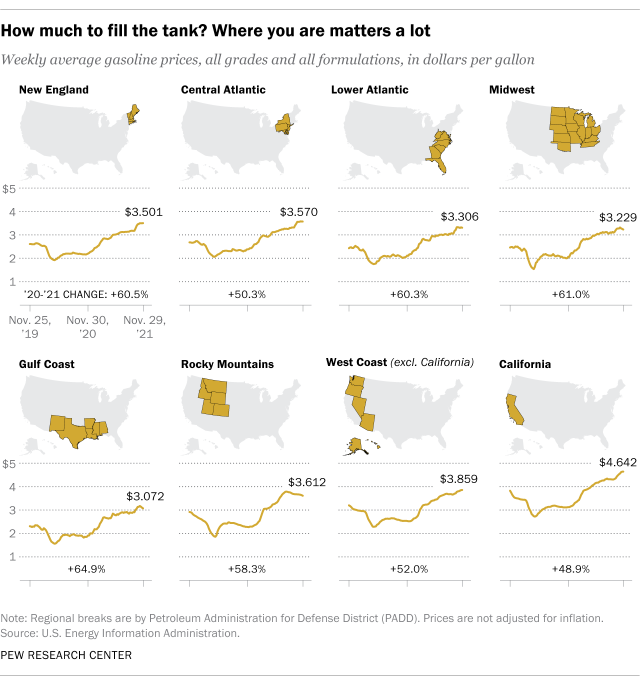
By contrast, California almost always has the most expensive gas in the country. The state’s average price in late November was $4.642 a gallon, and in San Francisco it was $4.816. Besides the fact that California already uses pricier reformulated gas and has relatively high gas taxes and environmental fees, it is geographically far removed from other refining centers and relatively few fuel pipelines cross the Rocky Mountains to connect California’s refineries to the rest of the country.
Under normal conditions, the state’s refineries can produce enough gasoline to meet demand there, according to the California Energy Commission. But if refineries go offline due to weather, accidents or mechanical breakdowns, the state typically imports gasoline from overseas – adding to the price because of the cost of marine shipments.
