
Non-Hispanic white Americans account for 60% of the U.S. population, but in a growing number of counties, a majority of residents are Hispanic or black, reflecting the nation’s changing demographics and shifting migration patterns.
In 2018, there were 151 U.S. counties where Hispanics, blacks or two much smaller racial and ethnic groups – American Indians and Alaska Natives – made up a majority of the population, according to a Pew Research Center analysis of U.S. Census Bureau data. That was an increase from 110 such counties in 2000. The 41 counties that joined the list between 2000 and 2018 are all majority Hispanic or majority black. (For a full list of these counties, see the sortable table at the end of the post.)
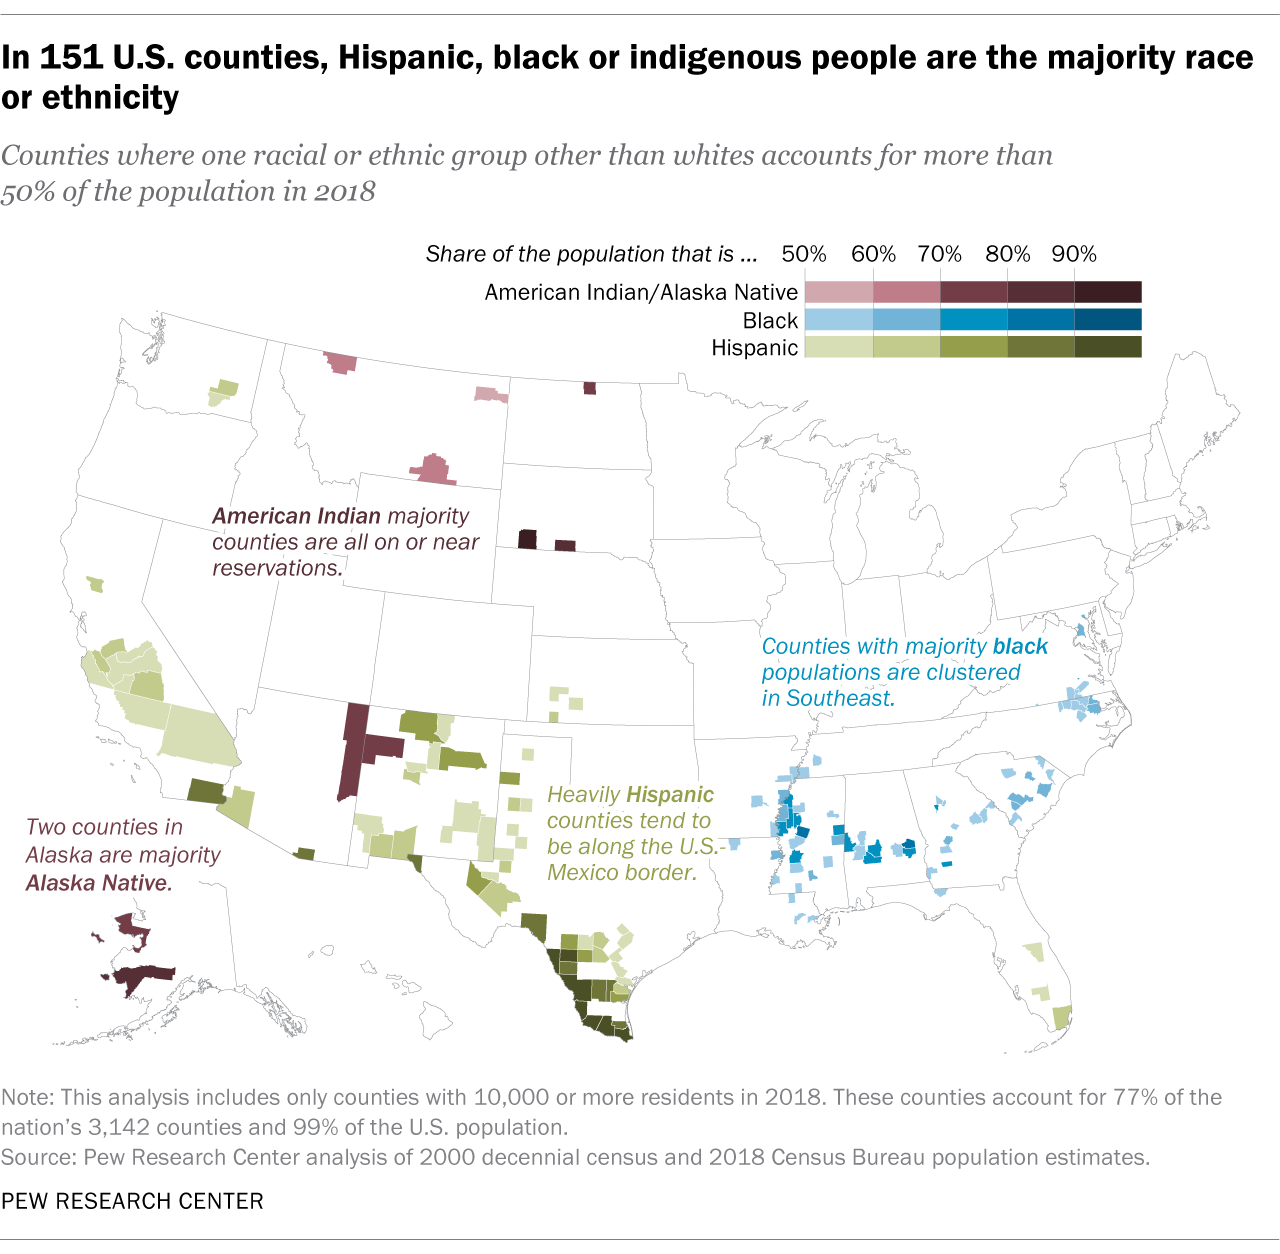
Overall, 69 counties were majority Hispanic in 2018, 72 were majority black and 10 were majority American Indian or Alaska Native. The majority American Indian or Alaska Native counties are unique in that most have experienced overall population declines since 2000, even as the share of American Indian or Alaska Native residents in these counties remained fairly flat.
[callout align=”alignright”]
Try our email course on the U.S. census
Learn about why and how the U.S. census is conducted through five short lessons delivered to your inbox every other day. Sign up now!
There were no U.S. counties where Asians accounted for more than half of the population, but in Honolulu County, Hawaii, the population was 42% Asian and 9% Native Hawaiian or Pacific Islander.
The South and Southwest of the United States hold most of the counties where Hispanic, black or indigenous people make up a majority of residents. These counties represent just 5% of the 3,142 counties in the U.S. and about half of the country’s 293 majority nonwhite counties (a figure that includes counties where multiple racial and ethnic groups combine to account for a majority).
About this analysis
This analysis includes only counties with a minimum population of 10,000 in 2018. These counties represent 77% of the nation’s 3,142 counties and include 99% of the U.S. population.
For this analysis, a majority is defined as more than 50% of the population.
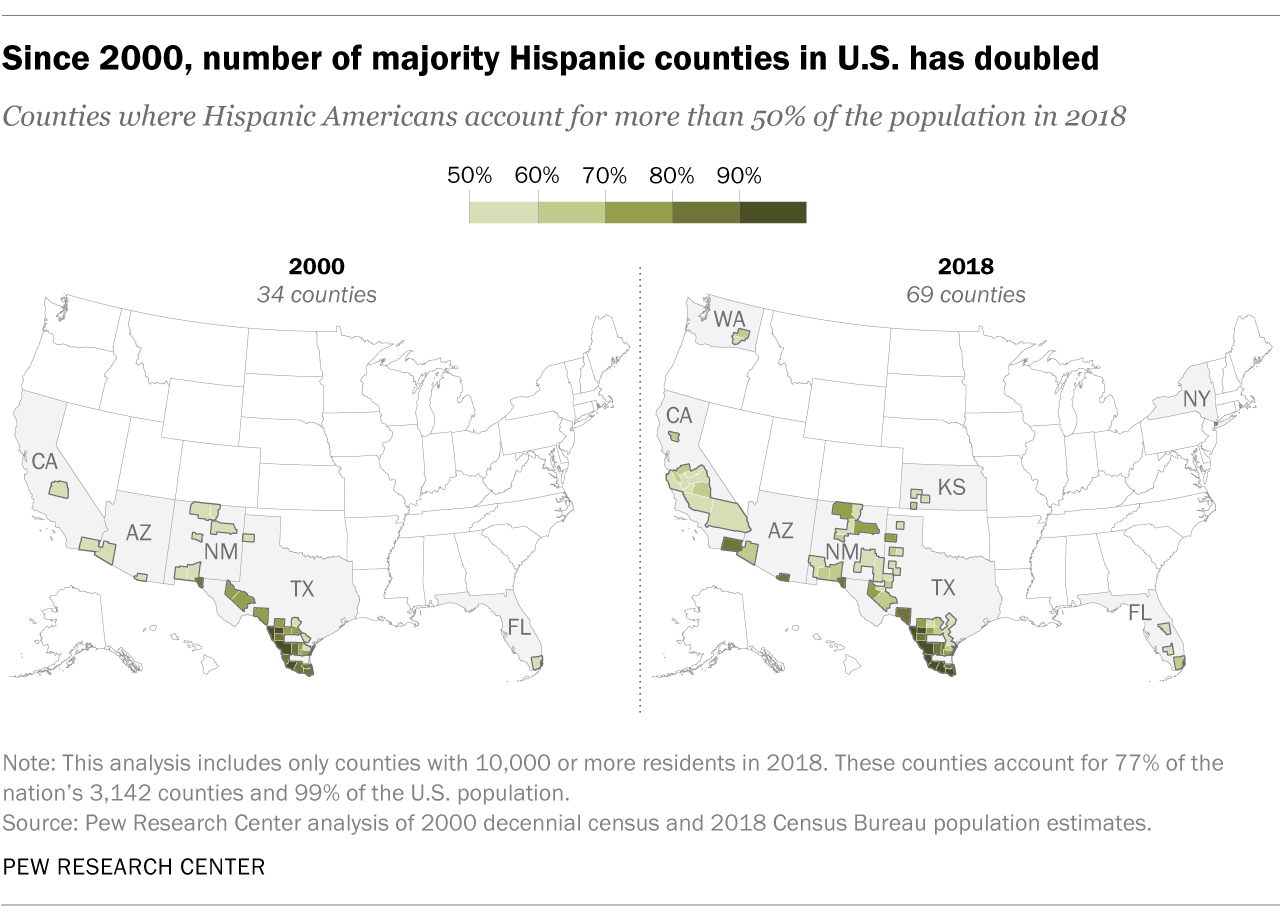
Rapid growth in majority Hispanic counties
The number of majority Hispanic counties doubled between 2000 and 2018, from 34 to 69 – mostly in the South and West. In all but four of these 69 counties, the Hispanic share of the population grew during that period. The few counties that experienced declines saw only slight decreases, and no county that was majority Hispanic in 2000 fell below 50% Hispanic by 2018.
These trends are in line with the growth of the U.S. Hispanic population as a whole, which reached a new high in 2018 even as its rate of growth slowed. The Latino population grew at a faster rate than most other racial or ethnic groups during the 2000s, due to relatively high birth rates among Hispanic women and immigration from Latin America.
Related: See Pew Research Center’s U.S. population projections through 2065, which provide a look at immigration’s impact on population growth and on racial and ethnic change.
In 2018, Texas was home to the 10 counties in the U.S. with the largest shares of Hispanic residents. Starr County, home to about 65,000 people overall, had the largest concentration of Hispanic residents, at 96% of the population. Other counties where Hispanics accounted for an especially large share of residents included Webb (95%), Hidalgo (92%) and Cameron counties (90%) – all in Texas.
The Hispanic populations of some larger U.S. counties also grew between 2000 and 2018. San Bernardino County, California (population 2.2 million) was the most populous county to become majority Hispanic during this span. Osceola County, Florida (home to about 370,000) saw the largest percentage point increase in Hispanic residents during this time (26 points, rising from 29% to 55%).
The migrating U.S. black population
While the black share of the total U.S. population has not changed substantially over the last two decades, the number of majority black counties in the U.S. grew from 65 to 72 between 2000 and 2018. One contributing factor may be migration of black Americans from the North to the South and from cities into suburbs.
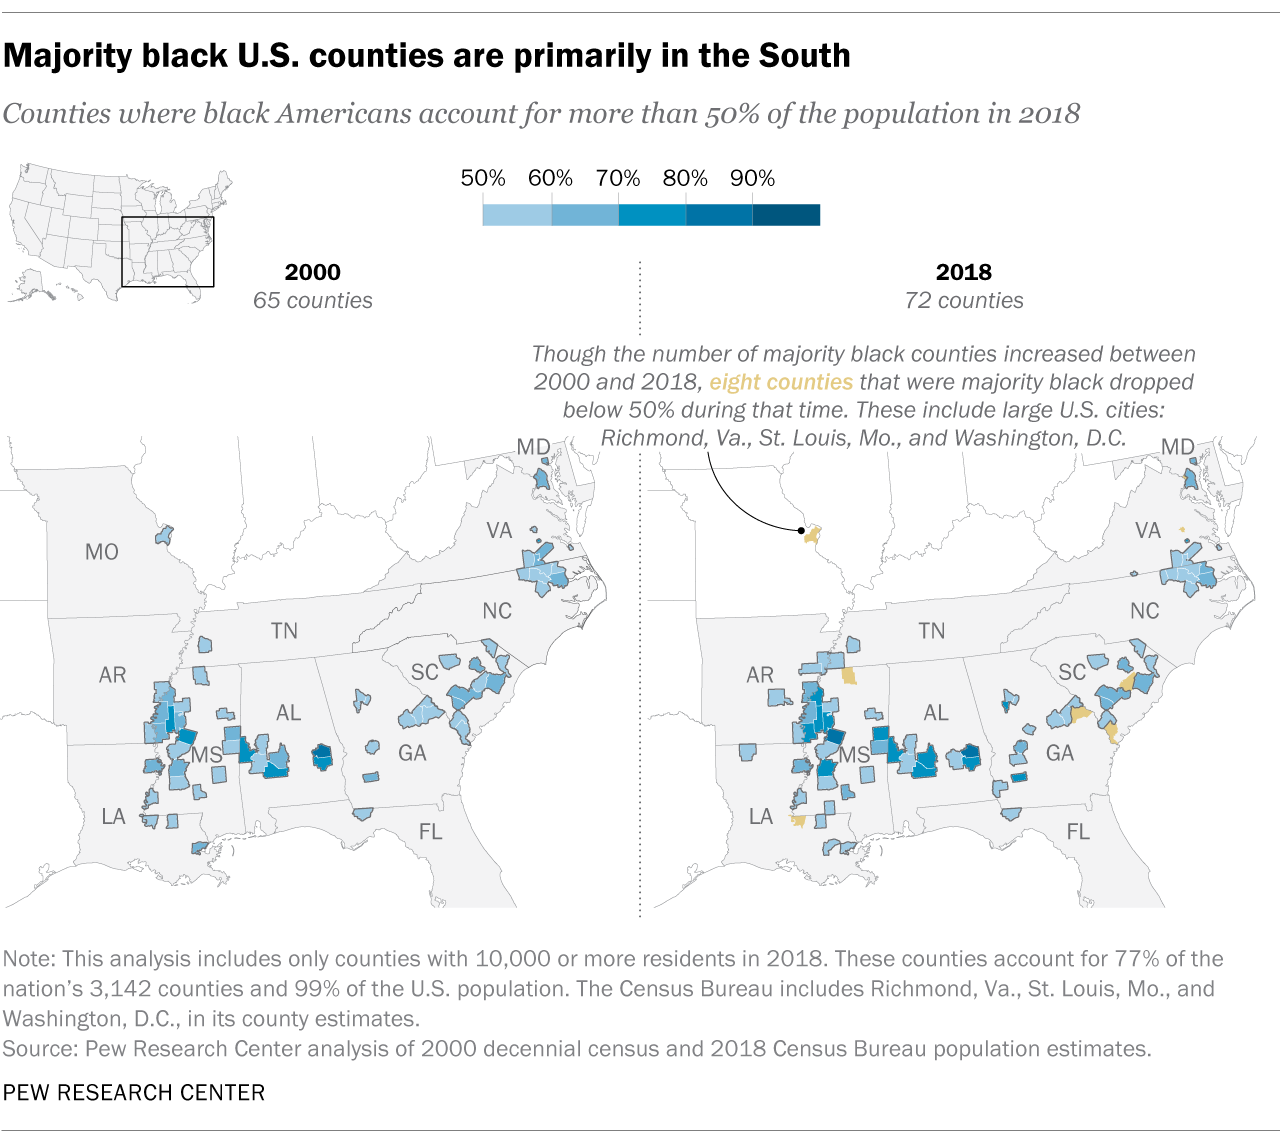
There are now 15 majority black counties that were not majority black in 2000. Among them, Rockdale County, Georgia, located about half an hour outside Atlanta, had the largest percentage point increase in the share of black residents (from 18% in 2000 to 55% in 2018). With about 930,000 residents, Shelby County, Tennessee, which contains Memphis, was the county with the largest population to become majority black.
The 10 counties with the highest shares of black residents in 2018 were in Mississippi (seven counties) Alabama (two) and Virginia (one). In these 10 counties, about 70% or more residents were black.
Meanwhile, eight counties that were majority black in 2000 are no longer. Three of these are large U.S. cities that the Census Bureau includes in its county estimates: Washington, D.C.; Richmond, Virginia; and St. Louis, Missouri. Washington (home to roughly 702,000 residents in 2018) saw a 19% increase in total population during that period, while its black population decreased by 9%. The city’s share of black residents declined by 15 percentage points, from 60% to 45%.
Majority American Indian or Alaska Native counties
In 2018, there were eight U.S. counties where more than half of the population was American Indian; two other counties were majority Alaska Native.
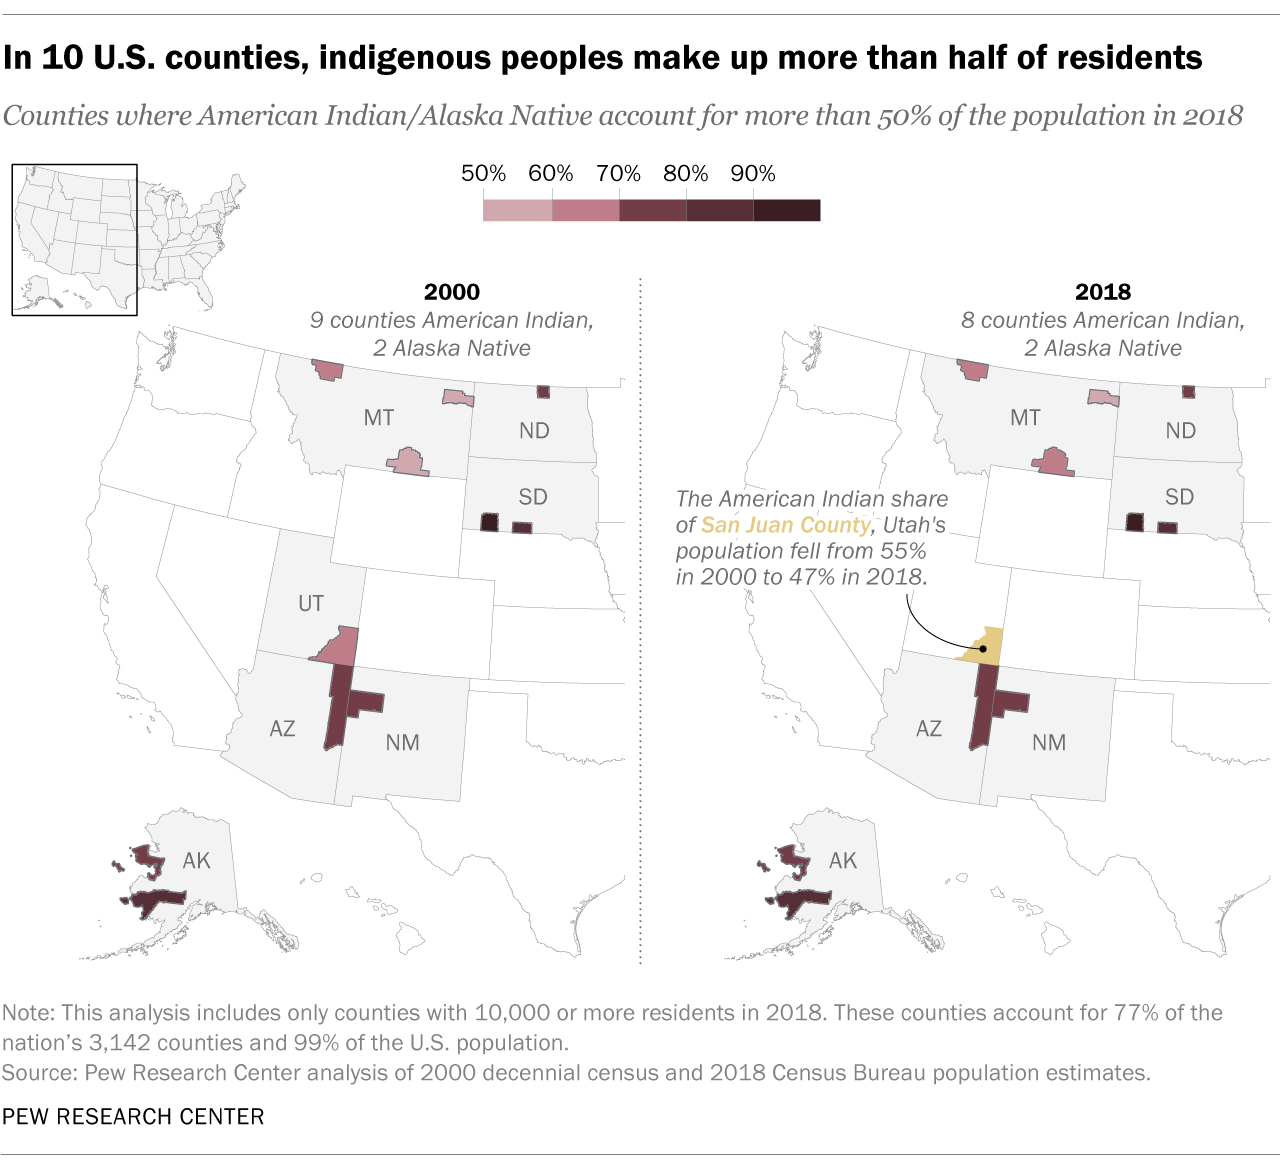
While majority Hispanic and black counties are growing in number, these predominantly American Indian or Alaska Native counties have experienced net population loss from 2000 to 2018. And one county that was majority American Indian or Alaska Native in 2000 is no longer: San Juan County, Utah, where the share of American Indian residents fell 8 percentage points, from 55% to 47%.
All 10 majority American Indian counties are located on or near reservation land in the Midwest and the West, and most have populations of fewer than 20,000 people. The exceptions are McKinley County, New Mexico, and Apache County, Arizona, both of which are home to about 72,000 people.
The two counties where the majority of residents were Alaska Native are both in rural Alaska: Bethel Census Area (population of roughly 18,000) and Nome Census Area (population of about 10,000).
Population in U.S. counties where Hispanic, black or indigenous people are a large share of residents
| State | County | % of population that was one racial/ethnic group other than white in 2000 | % of population that was one racial/ethnic group other than white in 2018 | Largest racial/ethnic group, 2018 |
| Alabama | Bullock County | 72.6% | 69.5% | Black |
| Alabama | Dallas County | 63.0% | 70.0% | Black |
| Alabama | Hale County | 59.2% | 57.8% | Black |
| Alabama | Macon County | 84.3% | 80.0% | Black |
| Alabama | Marengo County | 51.4% | 51.1% | Black |
| Alabama | Montgomery County | 48.5% | 58.5% | Black |
| Alabama | Sumter County | 72.4% | 71.4% | Black |
| Alabama | Wilcox County | 71.4% | 70.7% | Black |
| Alaska | Bethel Census Area | 81.7% | 82.3% | American Indian/Alaska Native |
| Alaska | Nome Census Area | 75.0% | 74.1% | American Indian/Alaska Native |
| Arizona | Apache County | 76.5% | 73.2% | American Indian/Alaska Native |
| Arizona | Santa Cruz County | 80.8% | 83.4% | Hispanic |
| Arizona | Yuma County | 50.5% | 64.3% | Hispanic |
| Arkansas | Chicot County | 53.5% | 53.4% | Black |
| Arkansas | Crittenden County | 46.9% | 53.7% | Black |
| Arkansas | Jefferson County | 49.4% | 56.8% | Black |
| Arkansas | Phillips County | 58.6% | 61.4% | Black |
| Arkansas | St. Francis County | 48.7% | 52.3% | Black |
| California | Colusa County | 46.5% | 60.3% | Hispanic |
| California | Fresno County | 44.0% | 53.5% | Hispanic |
| California | Imperial County | 72.2% | 84.6% | Hispanic |
| California | Kern County | 38.4% | 54.0% | Hispanic |
| California | Kings County | 43.6% | 55.0% | Hispanic |
| California | Madera County | 44.3% | 58.3% | Hispanic |
| California | Merced County | 45.3% | 60.2% | Hispanic |
| California | Monterey County | 46.8% | 59.1% | Hispanic |
| California | San Benito County | 47.9% | 60.6% | Hispanic |
| California | San Bernardino County | 39.2% | 54.0% | Hispanic |
| California | Tulare County | 50.8% | 65.2% | Hispanic |
| District of Columbia | District of Columbia | 59.9% | 44.9% | Black |
| Florida | Gadsden County | 57.0% | 55.1% | Black |
| Florida | Hendry County | 39.6% | 54.3% | Hispanic |
| Florida | Miami-Dade County | 57.3% | 69.1% | Hispanic |
| Florida | Osceola County | 29.4% | 55.3% | Hispanic |
| Georgia | Bibb County | 47.2% | 55.0% | Black |
| Georgia | Burke County | 50.8% | 46.9% | Black |
| Georgia | Clayton County | 51.4% | 69.9% | Black |
| Georgia | DeKalb County | 54.3% | 53.7% | Black |
| Georgia | Dougherty County | 60.0% | 70.3% | Black |
| Georgia | Early County | 47.8% | 51.0% | Black |
| Georgia | Jefferson County | 56.0% | 52.4% | Black |
| Georgia | Macon County | 59.2% | 59.8% | Black |
| Georgia | Richmond County | 49.5% | 56.0% | Black |
| Georgia | Rockdale County | 18.1% | 55.4% | Black |
| Georgia | Sumter County | 48.8% | 52.4% | Black |
| Georgia | Washington County | 53.1% | 53.3% | Black |
| Kansas | Finney County | 43.3% | 50.5% | Hispanic |
| Kansas | Ford County | 37.7% | 55.5% | Hispanic |
| Kansas | Seward County | 42.1% | 62.0% | Hispanic |
| Louisiana | Claiborne Parish | 47.1% | 51.6% | Black |
| Louisiana | Madison Parish | 60.2% | 62.4% | Black |
| Louisiana | Orleans Parish | 66.9% | 59.1% | Black |
| Louisiana | St. Helena Parish | 51.9% | 51.9% | Black |
| Louisiana | St. John the Baptist Parish | 44.6% | 57.0% | Black |
| Louisiana | West Feliciana Parish | 50.1% | 44.3% | Black |
| Maryland | Baltimore city | 64.2% | 61.9% | Black |
| Maryland | Prince George’s County | 62.6% | 61.9% | Black |
| Mississippi | Adams County | 52.5% | 52.4% | Black |
| Mississippi | Bolivar County | 64.8% | 63.6% | Black |
| Mississippi | Clay County | 56.1% | 58.5% | Black |
| Mississippi | Coahoma County | 68.9% | 76.6% | Black |
| Mississippi | Copiah County | 50.7% | 51.2% | Black |
| Mississippi | Hinds County | 60.9% | 72.4% | Black |
| Mississippi | Holmes County | 78.0% | 82.0% | Black |
| Mississippi | Jasper County | 52.7% | 53.0% | Black |
| Mississippi | Jefferson Davis County | 57.1% | 59.6% | Black |
| Mississippi | Kemper County | 57.7% | 60.7% | Black |
| Mississippi | Leflore County | 67.3% | 74.0% | Black |
| Mississippi | Marshall County | 50.1% | 47.0% | Black |
| Mississippi | Noxubee County | 68.9% | 71.8% | Black |
| Mississippi | Pike County | 47.3% | 53.1% | Black |
| Mississippi | Sunflower County | 69.5% | 73.2% | Black |
| Mississippi | Tallahatchie County | 59.0% | 56.7% | Black |
| Mississippi | Washington County | 64.3% | 71.9% | Black |
| Mississippi | Yazoo County | 53.6% | 56.7% | Black |
| Missouri | St. Louis city | 51.1% | 45.6% | Black |
| Montana | Big Horn County | 58.4% | 62.6% | American Indian/Alaska Native |
| Montana | Glacier County | 61.0% | 63.0% | American Indian/Alaska Native |
| Montana | Roosevelt County | 55.0% | 58.0% | American Indian/Alaska Native |
| New Mexico | Bernalillo County | 42.0% | 50.3% | Hispanic |
| New Mexico | Chaves County | 43.8% | 57.2% | Hispanic |
| New Mexico | Doña Ana County | 63.4% | 68.6% | Hispanic |
| New Mexico | Grant County | 48.8% | 50.7% | Hispanic |
| New Mexico | Lea County | 39.7% | 59.4% | Hispanic |
| New Mexico | Luna County | 57.8% | 67.6% | Hispanic |
| New Mexico | McKinley County | 73.4% | 73.9% | American Indian/Alaska Native |
| New Mexico | Rio Arriba County | 72.9% | 71.2% | Hispanic |
| New Mexico | San Miguel County | 78.0% | 77.5% | Hispanic |
| New Mexico | Santa Fe County | 49.0% | 51.1% | Hispanic |
| New Mexico | Taos County | 58.0% | 56.9% | Hispanic |
| New Mexico | Valencia County | 54.9% | 61.0% | Hispanic |
| New York | Bronx County | 48.4% | 56.4% | Hispanic |
| North Carolina | Bertie County | 62.1% | 60.7% | Black |
| North Carolina | Edgecombe County | 57.2% | 57.2% | Black |
| North Carolina | Halifax County | 52.3% | 53.1% | Black |
| North Carolina | Hertford County | 59.3% | 60.3% | Black |
| North Carolina | Northampton County | 59.4% | 56.9% | Black |
| North Carolina | Vance County | 48.0% | 50.5% | Black |
| North Carolina | Warren County | 54.4% | 50.6% | Black |
| North Dakota | Rolette County | 72.5% | 76.6% | American Indian/Alaska Native |
| South Carolina | Bamberg County | 62.2% | 59.8% | Black |
| South Carolina | Clarendon County | 53.0% | 46.9% | Black |
| South Carolina | Fairfield County | 58.9% | 57.0% | Black |
| South Carolina | Hampton County | 55.4% | 52.7% | Black |
| South Carolina | Jasper County | 52.5% | 41.0% | Black |
| South Carolina | Lee County | 63.4% | 63.6% | Black |
| South Carolina | Marion County | 56.1% | 56.3% | Black |
| South Carolina | Marlboro County | 50.6% | 50.6% | Black |
| South Carolina | Orangeburg County | 60.7% | 61.6% | Black |
| South Carolina | Williamsburg County | 66.0% | 64.4% | Black |
| South Dakota | Oglala Lakota County | 93.2% | 89.5% | American Indian/Alaska Native |
| South Dakota | Todd County | 84.5% | 82.6% | American Indian/Alaska Native |
| Tennessee | Haywood County | 50.9% | 50.2% | Black |
| Tennessee | Shelby County | 48.5% | 53.6% | Black |
| Texas | Andrews County | 40.0% | 56.6% | Hispanic |
| Texas | Atascosa County | 58.6% | 64.7% | Hispanic |
| Texas | Bee County | 53.9% | 59.3% | Hispanic |
| Texas | Bexar County | 54.3% | 60.5% | Hispanic |
| Texas | Caldwell County | 40.4% | 53.0% | Hispanic |
| Texas | Cameron County | 84.4% | 89.8% | Hispanic |
| Texas | Dawson County | 48.2% | 58.1% | Hispanic |
| Texas | Deaf Smith County | 57.4% | 73.5% | Hispanic |
| Texas | Dimmit County | 85.0% | 87.4% | Hispanic |
| Texas | Duval County | 88.0% | 89.1% | Hispanic |
| Texas | Ector County | 42.4% | 61.3% | Hispanic |
| Texas | El Paso County | 78.2% | 83.0% | Hispanic |
| Texas | Frio County | 73.8% | 79.3% | Hispanic |
| Texas | Gonzales County | 39.6% | 51.5% | Hispanic |
| Texas | Hale County | 47.9% | 59.7% | Hispanic |
| Texas | Hidalgo County | 88.4% | 92.4% | Hispanic |
| Texas | Jim Wells County | 75.7% | 80.4% | Hispanic |
| Texas | Karnes County | 47.4% | 55.3% | Hispanic |
| Texas | Kleberg County | 65.4% | 73.4% | Hispanic |
| Texas | Lamb County | 43.5% | 55.9% | Hispanic |
| Texas | Maverick County | 95.0% | 95.2% | Hispanic |
| Texas | Medina County | 45.5% | 52.4% | Hispanic |
| Texas | Moore County | 47.5% | 56.3% | Hispanic |
| Texas | Nueces County | 55.8% | 64.2% | Hispanic |
| Texas | Pecos County | 61.0% | 68.8% | Hispanic |
| Texas | Reeves County | 73.4% | 75.0% | Hispanic |
| Texas | San Patricio County | 49.4% | 58.4% | Hispanic |
| Texas | Starr County | 97.5% | 96.4% | Hispanic |
| Texas | Terry County | 44.1% | 55.9% | Hispanic |
| Texas | Uvalde County | 65.9% | 72.1% | Hispanic |
| Texas | Val Verde County | 75.5% | 82.5% | Hispanic |
| Texas | Ward County | 42.0% | 54.3% | Hispanic |
| Texas | Webb County | 94.3% | 95.5% | Hispanic |
| Texas | Willacy County | 85.7% | 88.4% | Hispanic |
| Texas | Zapata County | 85.4% | 94.6% | Hispanic |
| Texas | Zavala County | 91.2% | 93.9% | Hispanic |
| Utah | San Juan County | 55.2% | 47.4% | American Indian/Alaska Native |
| Virginia | Brunswick County | 56.7% | 54.6% | Black |
| Virginia | Danville city | 44.0% | 50.5% | Black |
| Virginia | Greensville County | 59.7% | 59.0% | Black |
| Virginia | Petersburg city | 78.7% | 76.3% | Black |
| Virginia | Portsmouth city | 50.4% | 53.3% | Black |
| Virginia | Richmond city | 57.2% | 46.8% | Black |
| Virginia | Sussex County | 62.0% | 56.1% | Black |
| Washington | Adams County | 47.1% | 64.3% | Hispanic |
| Washington | Franklin County | 46.6% | 53.5% | Hispanic |
