
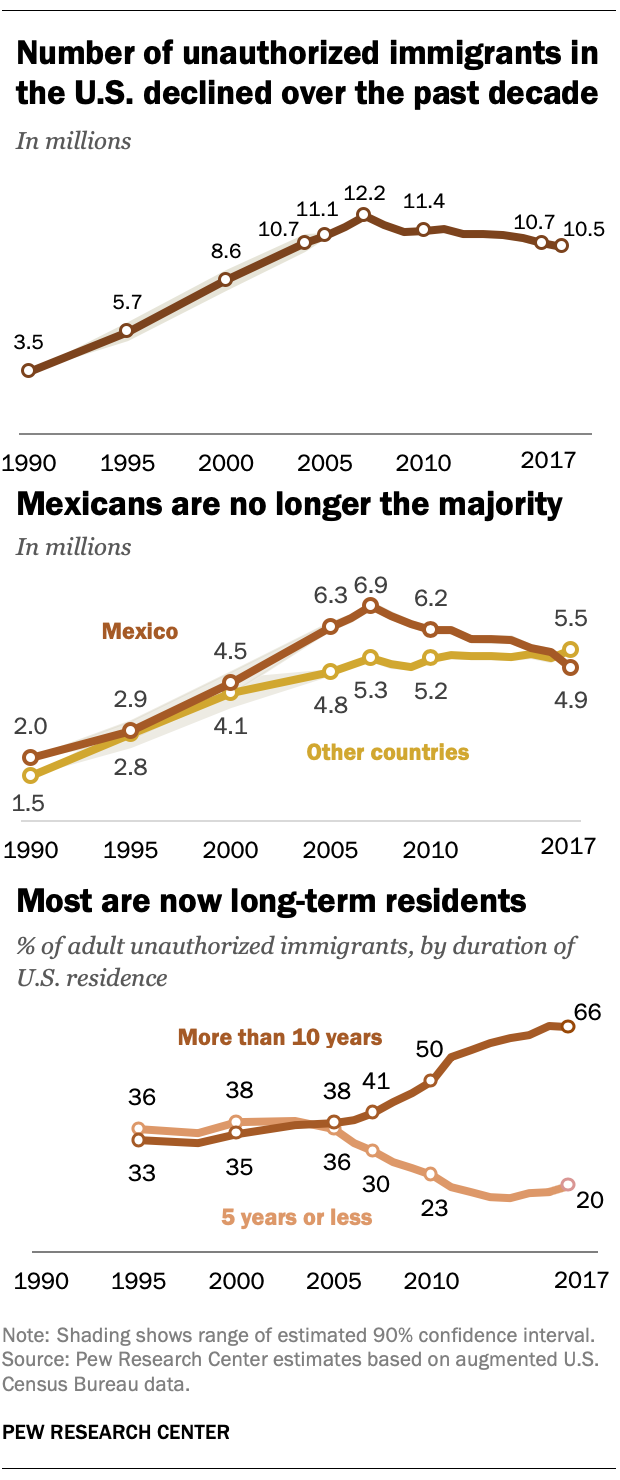
The number of Mexican unauthorized immigrants in the United States declined so sharply over the past decade that they no longer are the majority of those living in the country illegally, according to new Pew Research Center estimates based on government data. In 2017, there were 10.5 million unauthorized immigrants in the U.S., including 4.9 million Mexicans.
The decrease in the Mexican born was the major factor driving down the overall population of unauthorized immigrants in the U.S., which in 2017 was 1.7 million below its peak of 12.2 million in 2007.
The number of Mexican unauthorized immigrants declined because more left the U.S. than arrived. Mexicans remain a much larger percentage of all unauthorized immigrants than those from any other birth country. But their 47% share of U.S. unauthorized immigrants in 2017 amounted to less than a majority for the first time since the beginning of a long era of growth in illegal immigration a half century ago. That rise began after passage of a major overhaul of immigration policy in 1965, which imposed the first limits on immigration from Western Hemisphere countries, including Mexico, and coincided with the end of the Bracero program that had allowed temporary farm workers from Mexico to work legally in the U.S.
The number of Mexican unauthorized immigrants has fallen by 2 million since its peak of 6.9 million in 2007 and was lower in 2017 than in any year since 2001. Similarly, the number of apprehensions of Mexicans at the U.S. border also has fallen over the decade, a trend that began even earlier. In fact, apprehensions of non-Mexicans outnumbered those of Mexicans for the past three fiscal years, according to federal statistics.
As the number of Mexicans decreased, unauthorized immigrants from other parts of the world increased. There were 5.5 million non-Mexican unauthorized immigrants in 2017, compared with 5.3 million in 2007. The non-Mexican number also ticked up from 2016 to 2017, offsetting the decline of Mexicans. As a result, the overall population of unauthorized immigrants statistically did not change in 2017 from the year before; the total in both years was the lowest since 2004.
The decline in unauthorized immigrants from Mexico and rise from other parts of the world is one sign of a change in how recent arrivals to this population enter the country. A growing share of U.S. unauthorized immigrants do not cross the border illegally, but probably arrive with legal visas and overstay their required departure date. These “likely overstays” have made up a large majority of unauthorized immigrant arrivals since 2010, according to Pew Research Center analysis.
The Center’s estimate of unauthorized immigrants includes 1.5 million or more people who have temporary permission to stay in the U.S. but could be subject to deportation by changes in government policy. In 2017, they included about 320,000 people from 10 nations with Temporary Protected Status, about 700,000 beneficiaries of Deferred Action for Childhood Arrivals and a rising number of people who have applied for asylum and are awaiting a ruling.
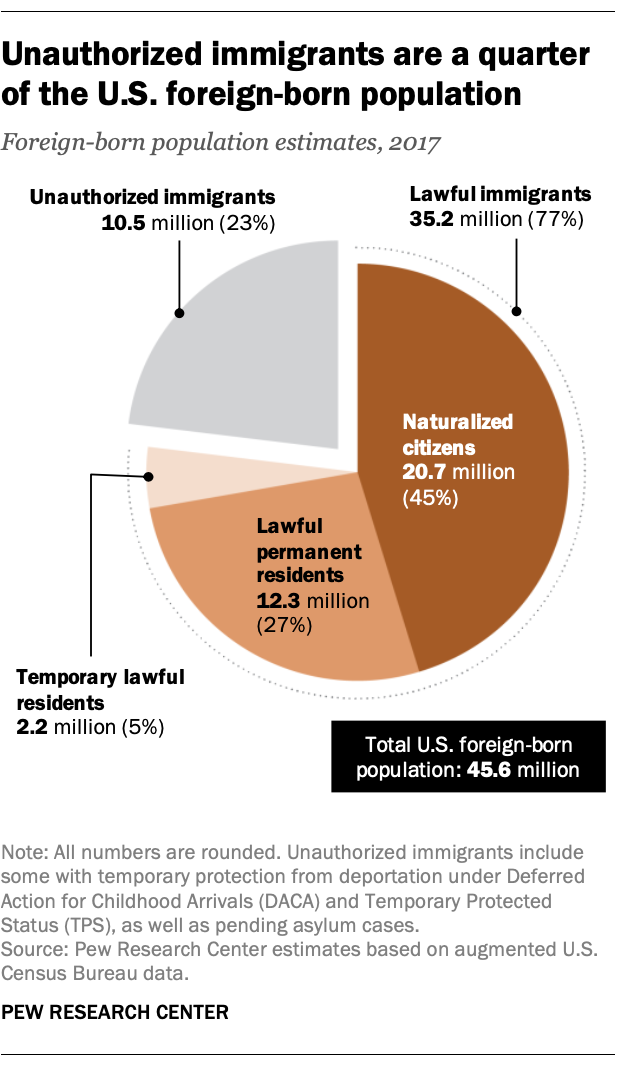
As the number of unauthorized immigrants shrank by 14% from 2007 to 2017, the U.S. lawful immigrant population continued to grow. During this period, the population of lawful U.S. immigrants – citizens and noncitizens, on permanent and temporary visas – rose by almost a quarter, to 35.2 million.
Unauthorized immigrants were 23% of the 45.6 million foreign-born residents in the U.S. in 2017.
Despite the decline over the decade, the number of unauthorized immigrants in 2017 was triple the 3.5 million in 1990.
Rising numbers from Asia and Central America
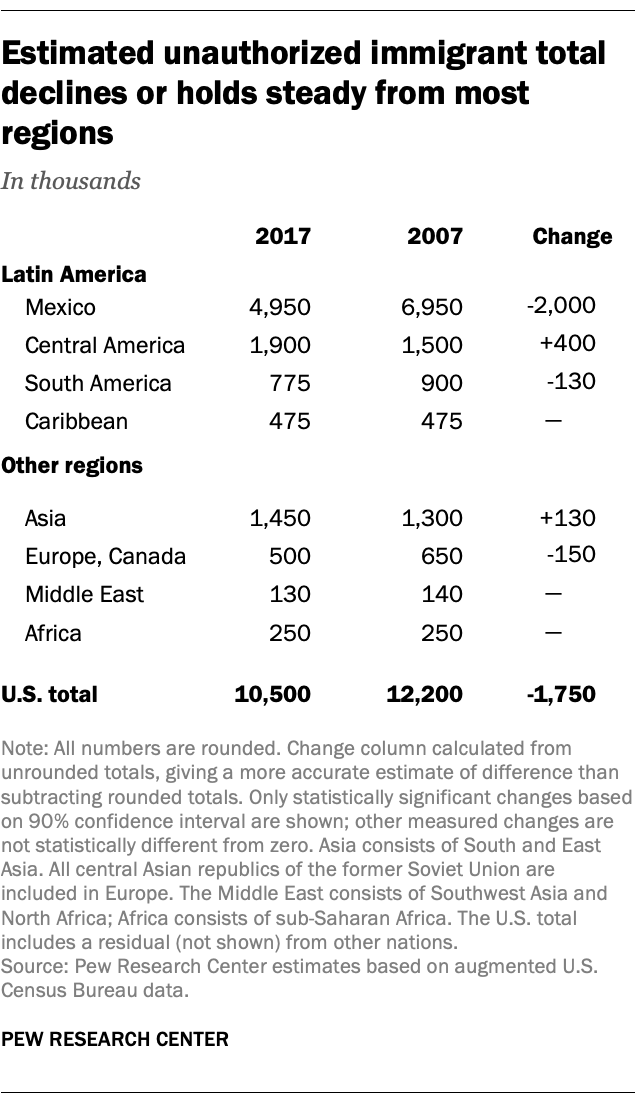
The number of unauthorized immigrants rose over the 2007-2017 decade from two birth regions: Asia and Central America. The numbers declined over the past decade from two others: South America and the combined regions of Europe and Canada. The decline was statistically significant among European-born unauthorized immigrants, but not among those from Canada.
Among the 20 birth countries with the largest number of U.S. unauthorized immigrants, there were statistically significant increases in five from 2007 to 2017. Reflecting the growth in unauthorized immigrants from Central America, they included the three Northern Triangle nations of El Salvador, Guatemala and Honduras, a trend also displayed in rising apprehensions of people from those countries at the border. India and Venezuela also had increases in their U.S. populations of unauthorized immigrants over the past decade.
However, looking at change from a year earlier, Brazil was the only large birth nation whose total unauthorized immigrant population in the U.S. grew by a statistically significant amount from 2016 to 2017.
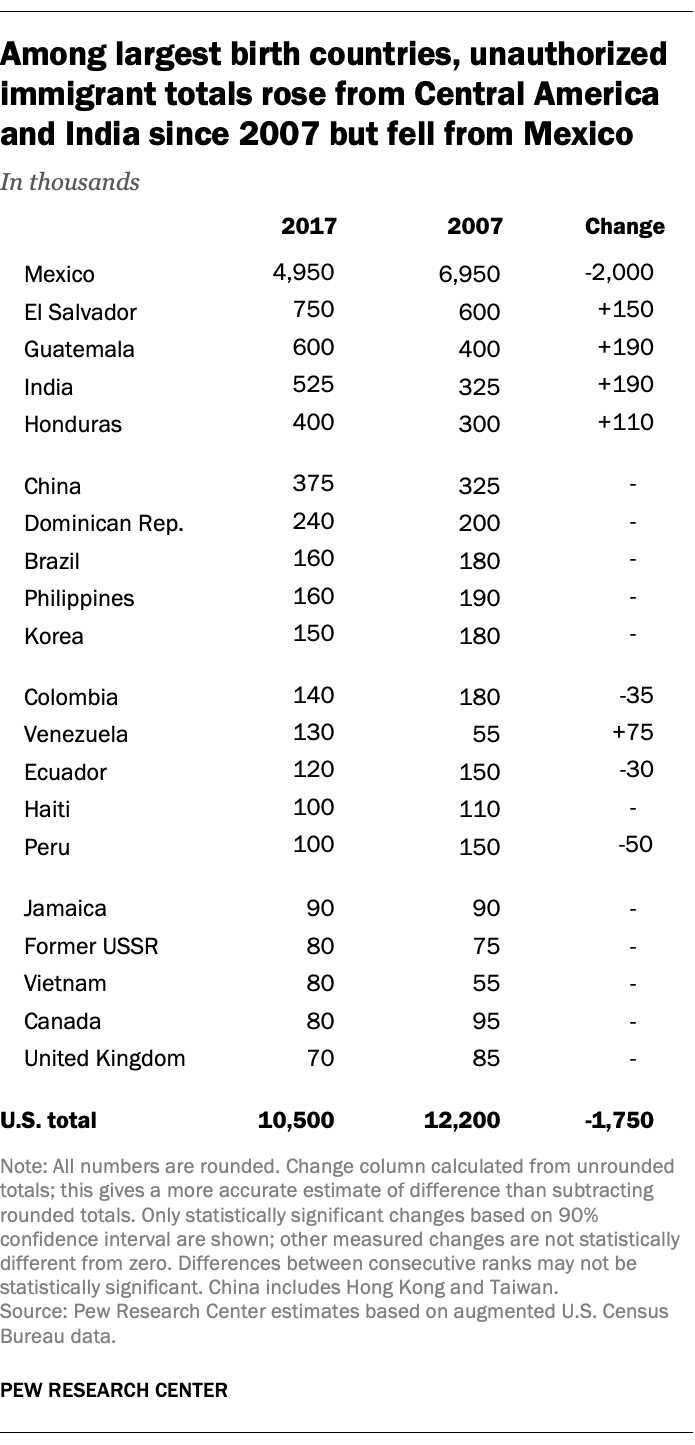
Large birth nations with unauthorized immigrant population declines over the decade, in addition to Mexico, included Colombia, Ecuador and Peru.
There may have been changes in unauthorized immigrant populations from other birth regions and countries, but they were not statistically significant.
Increases in five states and declines in a dozen others
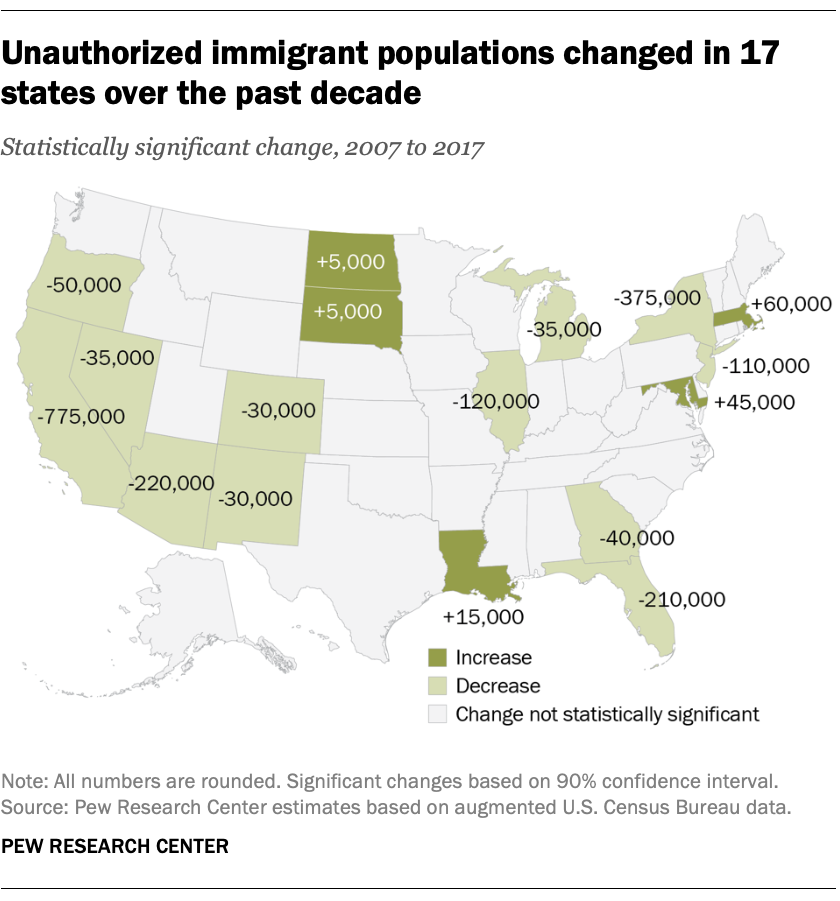
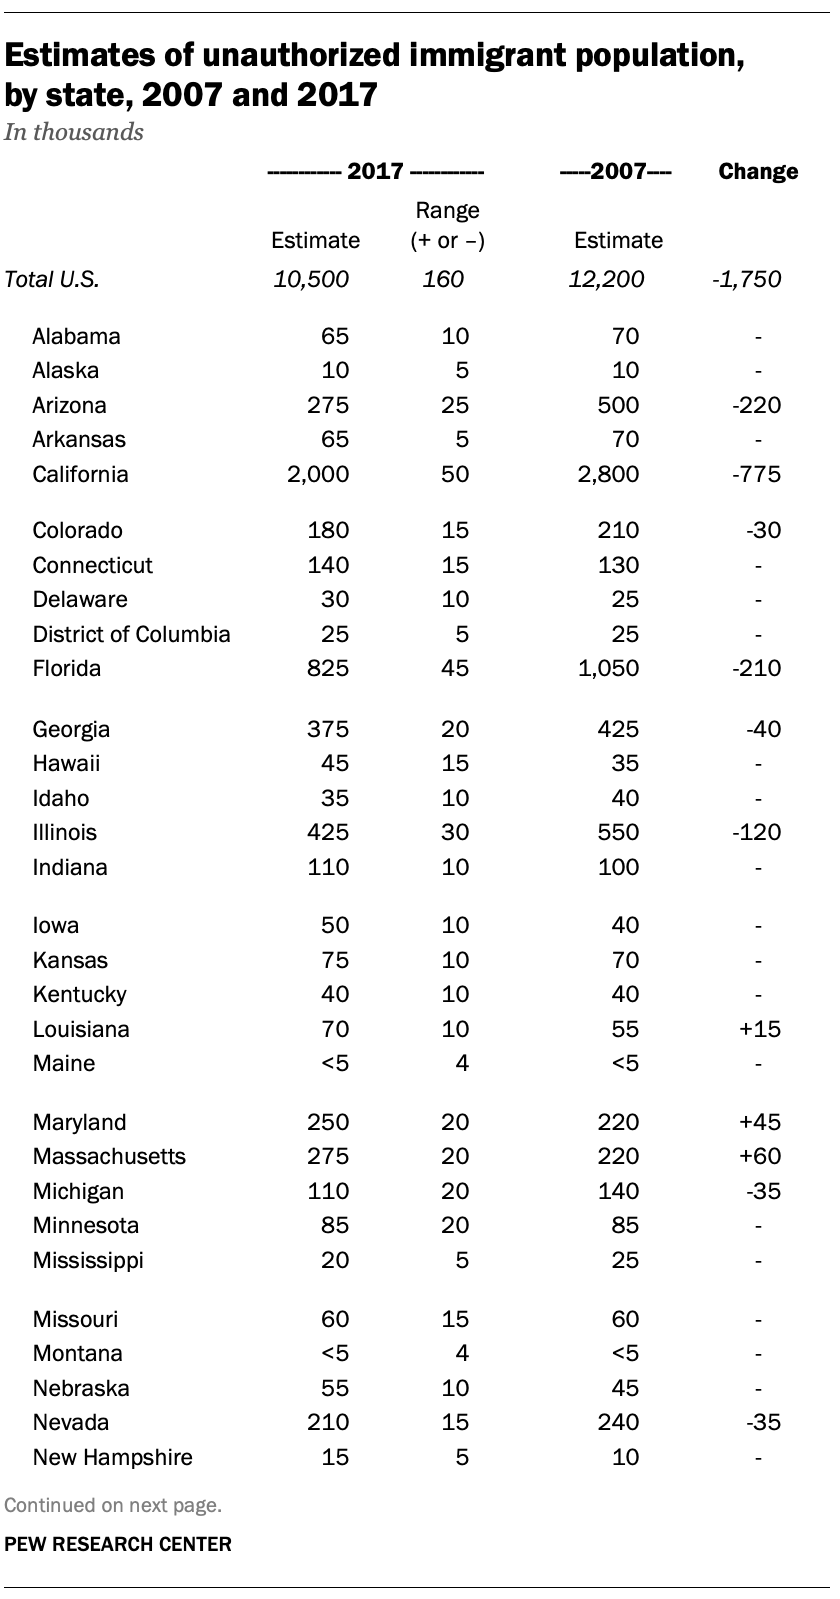
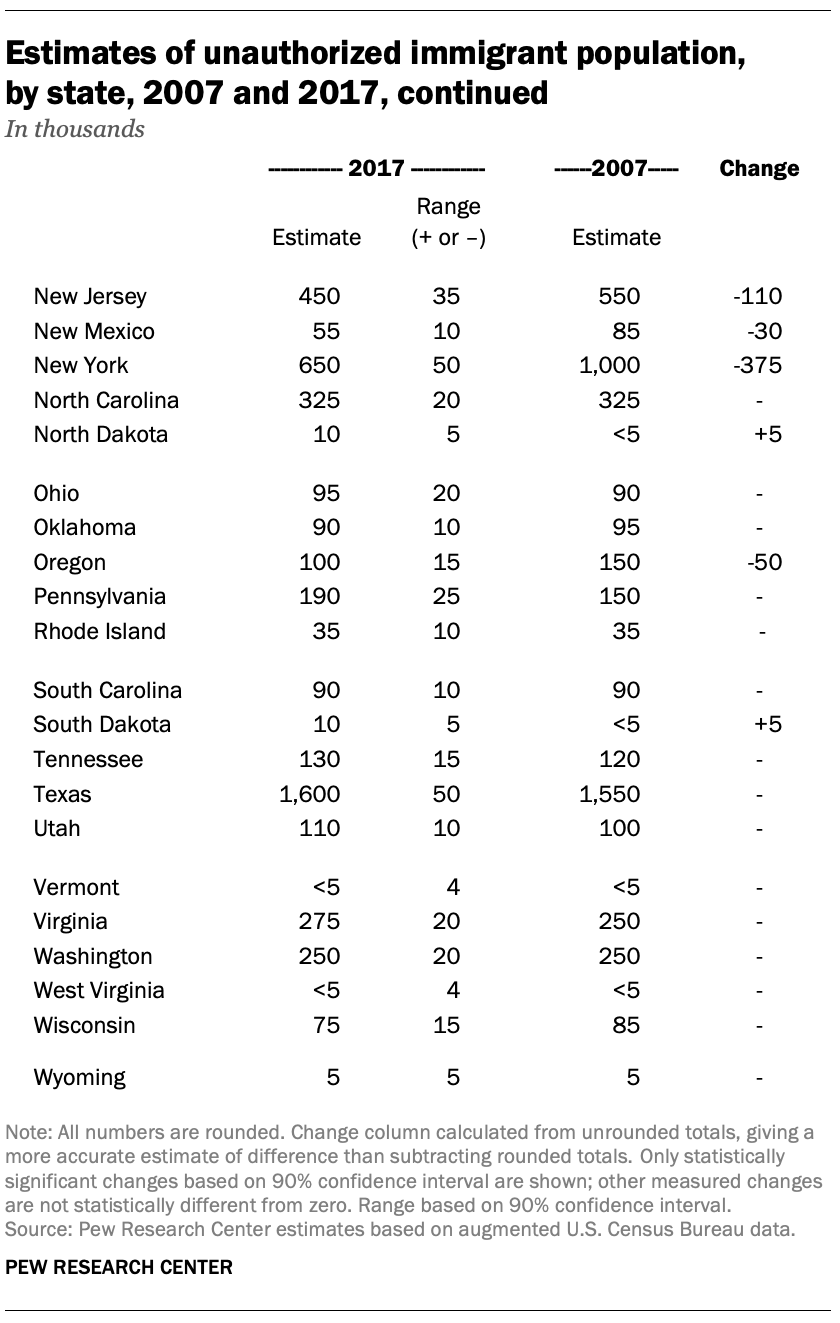
There were five states where unauthorized immigrant populations grew from 2007 to 2017 and 12 where they declined. States with growth included Louisiana, Maryland, Massachusetts, North Dakota and South Dakota.
Those with declines included five of the six states with the largest unauthorized immigrant populations: California, Florida, Illinois, New Jersey and New York (but not Texas, which had no statistically significant change). The other states with fewer unauthorized immigrants in 2017 than in 2007 were Arizona, Colorado, Georgia, Michigan, Nevada, New Mexico and Oregon.
Other states may have had changes, but they were not statistically significant.
Pew Research Center bases the estimates in this post on a “residual method” similar to those employed by the U.S. Department of Homeland Security’s Office of Immigration Statistics and nongovernmental organizations, such as the Center for Migration Studies and the Migration Policy Institute. Those organizations’ estimates are generally consistent with ours. Our estimates also align with official U.S. data sources, including birth records, school enrollment figures and tax data, as well as Mexican censuses and surveys.
The first step in our method is to use U.S. census counts and government surveys, such as the American Community Survey, to calculate how many immigrants live in the U.S. in a particular year. Next, we use official counts of immigrant admissions and other demographic data (death rates, for example) to determine how many of these immigrants live in the U.S. legally. Then we subtract those lawful immigrants from the total to get an estimate of the unauthorized immigrant population.
Based on experience and research, we know the census counts and other official surveys tend to miss some people. Unauthorized immigrants are especially likely to be missed. Therefore, we do a further assessment of potential undercounts or undercoverage. Based on this additional research, our final estimate of the U.S. unauthorized immigrant population includes an upward adjustment for undercount. (Our 1990 estimate comes from work by Robert Warren and John Robert Warren; details can be found here.)
The term “unauthorized immigrant” reflects standard and customary usage by many academic researchers and policy analysts; it generally has been the term used by the U.S. Department of Homeland Security (Office of Immigration Statistics). Other terms such as undocumented or illegal immigrants also have been used to describe this population.
For more details, see the Methodology section of this previously published report.
Long-term residents outnumber more recent arrivals
The decline in unauthorized immigrants over the decade is largely due to decreases in new arrivals to the U.S., especially by Mexicans (although some unauthorized immigrants also have left, died or were deported). As a result, the unauthorized immigrant population in the U.S. increasingly is made up of longer-term residents.
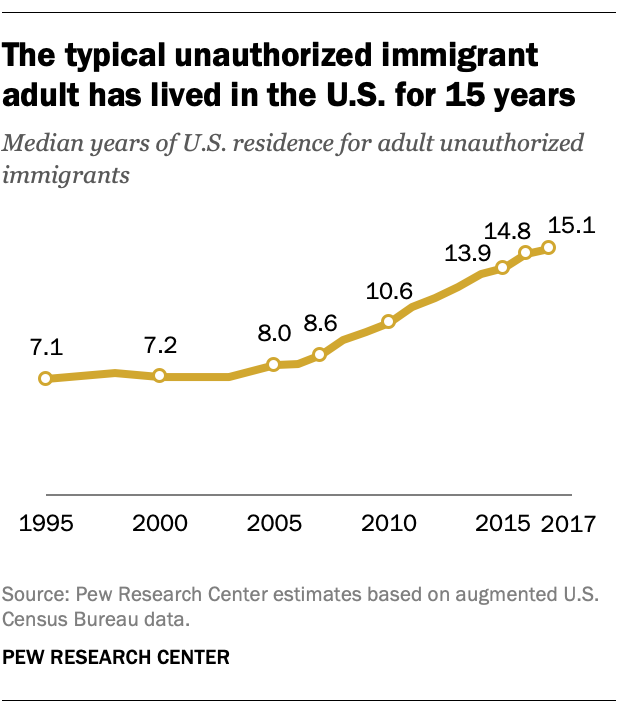
In 2017, the typical unauthorized immigrant adult had lived in the U.S. for 15 years. That is the longest median duration of residence since 1995, when Pew Research Center estimates began.
In 2017, only 20% of unauthorized immigrant adults lived in the U.S. for five years or less, down from 30% a decade earlier. About two-thirds of unauthorized immigrants have been in the U.S. for more than 10 years; a decade earlier, less than half had.
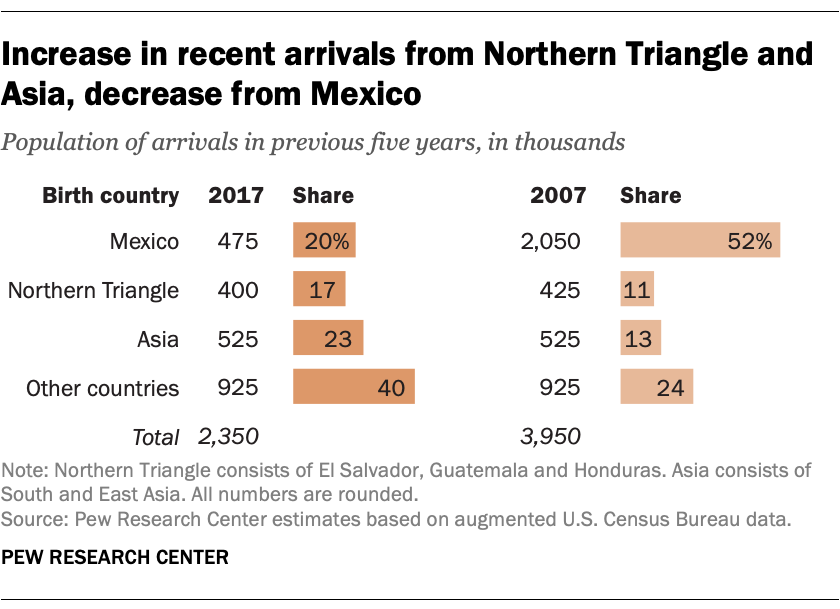
The large drop in new arrivals is almost entirely due to a drop in the number of Mexican unauthorized immigrants coming to the U.S. In 2017, Mexicans accounted for 20% of unauthorized immigrants who came to the U.S. in the previous five years, compared with 52% in 2007. This represents a decrease in the average annual inflow of Mexican unauthorized immigrants, from about 375,000 per year in 2002-2007 to about 90,000 per year for 2012-2017. For other regions of birth, the average annual inflows did not change significantly, but the shares of the total increased due to declining Mexican arrivals.
Fewer unauthorized immigrants in the workforce than a decade ago
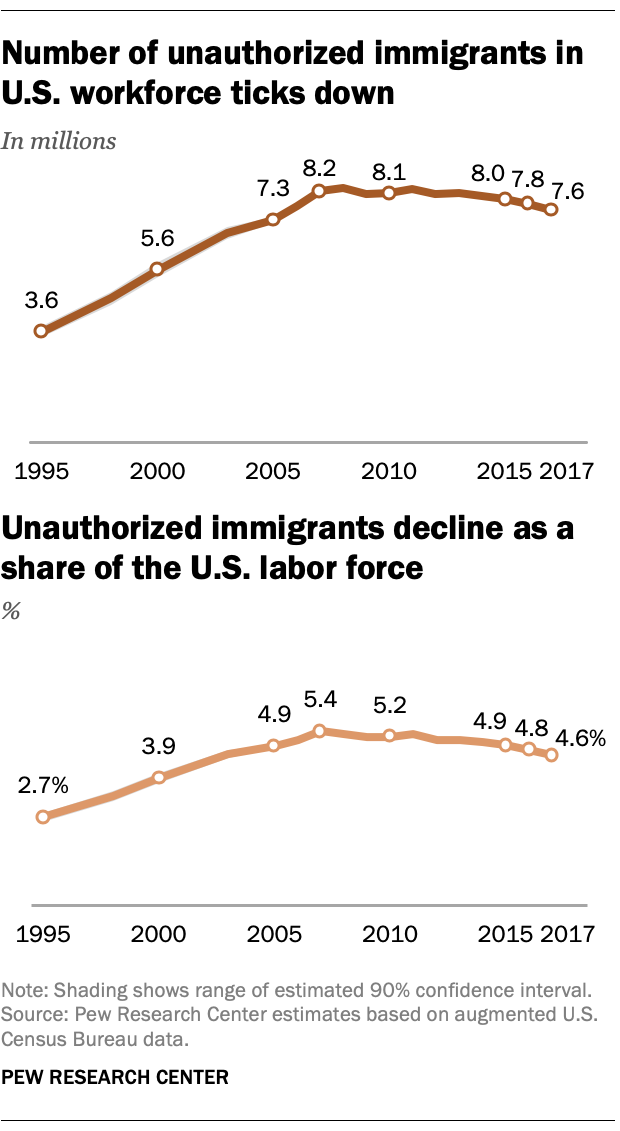
The number of unauthorized immigrants in the labor force – working or looking for work – declined to 7.6 million in 2017, less than the total of the previous year and notably less than in 2007, when they were 8.2 million.
Unauthorized immigrants made up 4.6% of the labor force in 2017, down from 5.4% in 2007.
Correction (June 24, 2019): A previous version of the chart “Mexicans are no longer the majority” gave an incorrect number of unauthorized immigrants from countries other than Mexico in 1990. There were 1.5 million.

