
The STEM workforce (science, technology, engineering and math) has grown rapidly in recent decades. An updated analysis by the Bureau of Labor Statistics since the coronavirus outbreak began projects strong growth for many STEM occupations in the United States, particularly epidemiologists, medical scientists, biochemists and biophysicists, and biological technicians, among others.
But Black and Hispanic workers remain underrepresented in STEM jobs compared with their share of the U.S. workforce, according to a new Pew Research Center analysis of U.S. government data. The representation of women varies significantly across the job clusters that make up the STEM workforce: In health-related jobs, women are overrepresented compared with their 47% share of the overall workforce, while they remain starkly underrepresented in computing and engineering jobs.
The prospects for increasing diversity in the STEM workforce are closely tied to the educational system. Even with dramatic growth in the number of STEM graduates from U.S. colleges and universities at all degree levels since 2010, there is little indication that diversity in related jobs will shift substantially in the near term.
Here are six facts about the STEM workforce and STEM training.
This analysis of federal government data looks at gender, racial and ethnic diversity among those employed in and earning degrees in science, technology, engineering and math (STEM). Analysis of the STEM workforce is based solely on occupation, using data from the U.S. Census Bureau’s 1990 and 2000 U.S. decennial censuses and aggregated 2014-2016 and 2017-2019 American Community survey data provided through Integrated Public Use Microdata Series (IPUMS) from the University of Minnesota. A 2018 Center report used the same occupation classifications to analyze the STEM workforce from 1990 to 2016.
Analysis of STEM degrees awarded is based on data from the U.S. Department of Education’s National Center for Education Statistics (NCES), Integrated Postsecondary Education Data System (IPEDS) Completions survey. The analysis was done using the National Center for Science and Engineering Statistics Interactive Data Tool. Postsecondary institutions participating in Title IV federal financial aid programs are required to report. Degree programs were classified using the NCES’s Classification of Instructional Programs (CIP) scheme.
Black and Hispanic workers are underrepresented in STEM jobs relative to their shares in the U.S. workforce as a whole. Black workers make up 9% of the STEM workforce, smaller than their share of all employed U.S. adults (11%). They comprise just 5% of those in engineering and architecture and 6% each in life and physical science jobs.
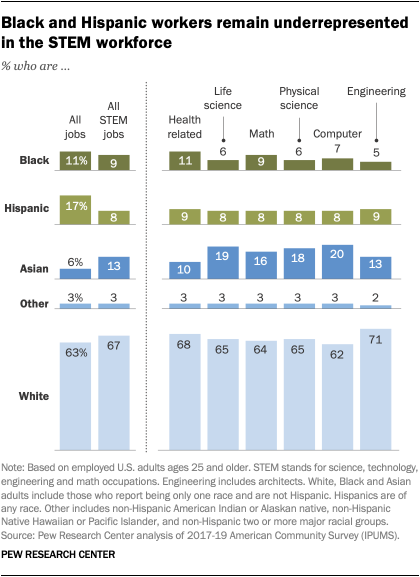
Overall, 11% of those in health-related jobs are Black. The share of Black workers in specific health-related occupations ranges from 26% of licensed practical and licensed vocational nurses to just 2% of optometrists, veterinarians and chiropractors. Black workers make up 5% of physicians and surgeons and 4% of dentists.
Hispanic workers represent 8% of the STEM workforce, substantially lower than their 17% share of all employed. The share of Hispanics is similarly low (8% to 9%) across STEM job clusters.
Asian Americans are overrepresented in the STEM workforce (13%) compared with their share of all employed (6%). They account for a larger share of computer workers (20%), life scientists (19%) and physical scientists (18%), and 10% of those in health-related jobs. There can be wide variation across the occupations that make up each STEM job cluster. In engineering and architecture occupations, the share of Asian workers ranges from 31% of computer hardware engineers to 1% of surveying and mapping technicians.
Native Americans, Native Hawaiians, Pacific Islanders and people who identify with two or more racial groups account for 3% of STEM workers.
White workers are overrepresented in STEM jobs (67%) compared with their 63% share of workers across all occupations. They make up 71% of engineers and 62% of computer workers.
Black and Hispanic graduates are underrepresented among degree recipients in STEM fields compared with their share of all degrees. As with patterns in the STEM workforce, the share of Black and Hispanic students earning STEM degrees is generally lower than their share of all degree recipients.
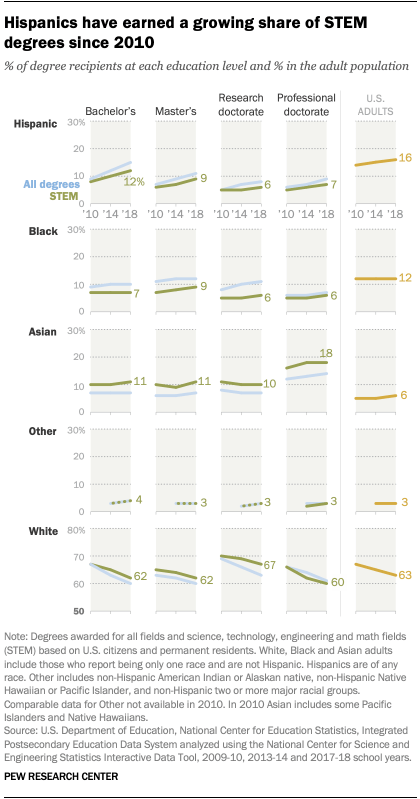
Black students earned 7% of STEM bachelor’s degrees for the 2017-2018 academic year, the most recent year available, smaller than their share of all bachelor’s degrees (10%). The share of Hispanic students awarded a bachelor’s degree in a STEM field (12%) is below their share earning bachelor’s degrees in any field (15%).
Hispanic adults earned 9% of STEM master’s degrees awarded to U.S. citizens and permanent residents in the 2017-2018 school year, smaller than their 11% share of all master’s degrees. Hispanic students earned just 6% of research doctorates and 7% of professional doctorates in STEM.
Black students earned 9% of master’s degrees, 6% of research doctorates and 6% of professional doctorates in STEM fields.
Asian students are overrepresented among those awarded STEM degrees at all levels compared with their share earning degrees across all fields. For example, Asian students received 11% of master’s degrees in STEM fields, while they earned 7% of all master’s degrees in 2018.
White students earned 62% of bachelor’s degrees in STEM fields, compared with 60% of all college-level degrees. White adults earned 67% of research doctorates in STEM fields during the 2017-2018 school year, more than their 63% share of all degrees.
The share of women is uneven across STEM job types. Women make up half of the STEM workforce, slightly larger than their share of the overall workforce (47%). But the share of women varies widely across STEM job clusters.
Women comprise about three-quarters of health care practitioners and technicians (74%), the largest occupational cluster classified as STEM in this analysis, with 9.8 million workers – about 7.3 million of whom are women.
The shares of women in the life sciences (48%) and math (47%) closely match the shares of women in the overall workforce.
Women remain underrepresented in engineering (15%), computer (25%) and physical science (40%) occupations.
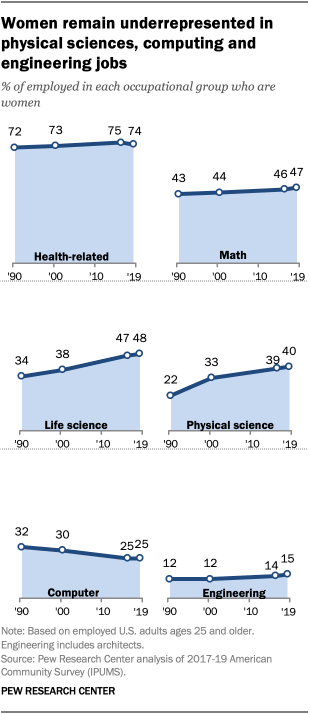
Women have made significant gains in life science and physical science jobs, but other areas have seen few increases. The share of women working in the life sciences (such as the biological or agricultural sciences) is up 14 percentage points since 1990. Women now comprise 48% of all workers in the life sciences, up from 34% in 1990.
The share of women in the physical sciences (such as astronomy, physics or chemistry) also rose, from 22% in 1990 to 40% as of 2019, the most recent year data is available.
The share of women has been roughly stable in other STEM job clusters. In engineering, women’s shares have inched up only slightly, from 12% in 1990 to 15% today. And the share of women in computer occupations went down over this period. In 1990, 32% of workers in computer occupations were women; today, women make up 25%, unchanged since 2016.
Women earn a large share of degrees in health-related and life science fields, far fewer in other STEM areas. Women earned a majority of STEM bachelor’s degrees in 2018 (53%), but that was smaller than their share of all bachelor’s degrees (58%). Women made up a large majority of bachelor’s degree recipients in health-related fields (85%) and a 61% majority of college graduates in the life sciences as of 2018.
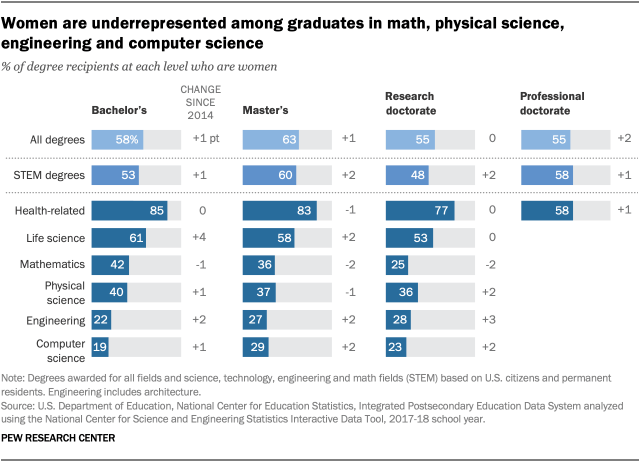
But women earned a minority of bachelor’s degrees in other STEM fields. For the 2017-2018 academic year, women earned 22% of all bachelor’s degrees in engineering and 19% of all bachelor’s degrees in computer science. Women earned fewer than three-in-ten of the advanced degrees in these fields.
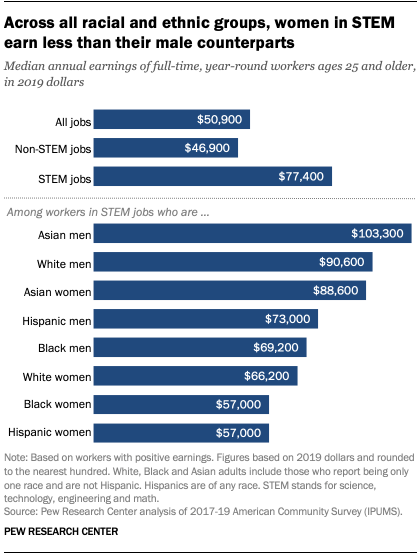
STEM workers typically earn more than those in other jobs, with the highest median pay for Asian men and the lowest for Black and Hispanic women. STEM workers enjoy higher median earnings than those in other, non-STEM occupations. In 2019, median earnings for full-time, year-round workers ages 25 and older in a STEM job were about $77,400. The comparable median for workers in other, non-STEM occupations was $46,900.
There are sizable pay gaps between women and men in STEM jobs as well as across racial and ethnic groups.
The median earnings of women in STEM occupations are about 74% of men’s median earnings in STEM.
The median earnings of Black STEM workers are 78% of the median earnings of White STEM workers. A typical Hispanic STEM worker makes 83% of what a typical White STEM worker makes. The typical Asian worker in STEM earns $99,100, 127% that of a comparable White worker ($78,000).
The gender pay gap among STEM workers holds across racial and ethnic groups such that the median earnings for STEM workers is highest for Asian men ($103,300) and lowest for Black and Hispanic women ($57,000 each).
Note: This is an update of the post “7 facts about the STEM workforce” by Nikki Graf, Richard Fry and Cary Funk, originally published Jan. 9, 2018.


