

With three-and-a-half months to the midterm elections, it’s still unclear the extent to which Republicans’ advantage in voter engagement will translate into more actual House and Senate seats. But we’ll go out on a limb on two predictions: A lot fewer people will vote this year than did in 2012, and Democrats are likely to suffer accordingly.
Voter turnout regularly drops in midterm elections, and has done so since the 1840s. In 2008, for instance, 57.1% of the voting-age population cast ballots — the highest level in four decades — as Barack Obama became the first African American elected president. But two years later only 36.9% voted in the midterm election that put the House back in Republican hands. For Obama’s re-election in 2012, turnout rebounded to 53.7%.
Who turns out to vote and why is of much more than academic interest. In an era of increasingly polarized politics, campaign strategists must decide how much effort to put into persuading independent-minded voters to come out and support their candidate without antagonizing their party’s core supporters, who are more likely to vote anyway. Obama’s victories in 2008 and 2012 were largely due to his campaign’s success in expanding the electorate — inspiring new voters and increasing turnout among blacks.
Turnout calculations can vary somewhat depending on which population estimate is used as a base and which vote measure is compared against it. For our chart, we used Census estimates of the voting-age population each year since 1948 and vote totals as compiled by the Clerk of the House.
Some researchers, though, argue that focusing on the voting-age population, rather than the people actually eligible to vote, distorts the picture. For instance, Michael McDonald, a University of Florida political scientist, estimates that in 2012 roughly 20.5 million U.S. residents aged 18 and up, or 8.5% of the voting-age population, were non-citizens and, hence, ineligible to vote. Another 3.2 million couldn’t vote because they were in prison or had been convicted of a felony.
By subtracting those people, and adding in the 4.7 million American citizens living overseas but still eligible to vote, McDonald estimates the “voting-eligible population,” or VEP, in 2012 was 222.3 million. Based on that adjusted base, turnout in recent elections was rather higher: 61.6% in 2008, 39.9% in 2010 and 58.2% in 2012.
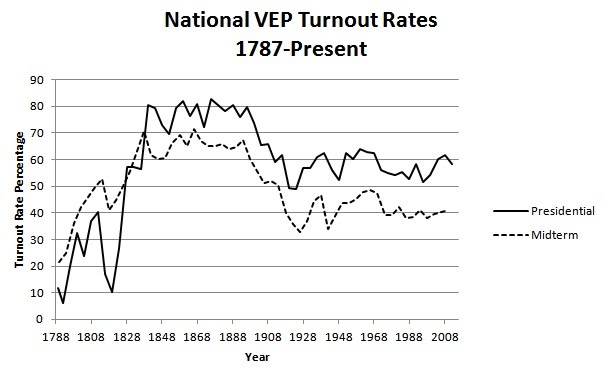
History break: As McDonald’s chart shows, in the early decades of the republic, midterm elections typically drew more voters than presidential contests. Back then, most states only gave voting rights to property owners, and Congress — not the presidency — tended to be the federal government’s main power center and focus of electoral campaigns. Those conditions changed in the 1820s during the Second Party System, when most states repealed property qualifications, interest in politics soared as politicians increasingly appealed to ordinary people, and the parties directed much of their energy on capturing the White House after the disputed 1824 election (which John Quincy Adams won even though Andrew Jackson received the most votes). By 1840, turnout among the white, male electorate topped 80%; the total number of votes cast that year was 60% higher than in 1836. (Blacks received the right to vote in 1870 with the Fifteenth Amendment, women in 1920 with the Nineteenth Amendment.)
Though political scientists long have noted the midterm dropoff, they don’t agree on precisely what it means. In an influential 1987 article, James E. Campbell theorized that “the surge of interest and information in presidential elections” typically works to the advantage of one party or the other; that party’s partisans become more likely to vote, while those of the disadvantaged party are more likely to stay home during presidential elections. Independents, “lacking a standing partisan commitment…should divide disproportionately in favor of the advantaged party.” Midterm elections lack that “wow” factor, according to Campbell, and turnout among both partisans and independents return to more normal levels and patterns.
A recent paper by Brown University researcher Brian Knight seeks to evaluate that surge-and-decline theory, as well as two competing explanations of why the president’s party nearly always loses seats at the midterms: a “presidential penalty,” or general preference among midterm voters for expressing dissatisfaction with the president’s performance or ensuring that his party doesn’t control all the levers of government, and recurring shifts in voter ideology between presidential and midterm elections. Knight concluded that while all three factors contribute to what he calls the “midterm gap,” the presidential penalty has the most impact.
In any event, if 2014 follows the trend Democrats are almost certain to lose seats in the House and Senate this November, and many pollsters predict as much. As Knight notes, since 1842 the President’s party has lost seats in 40 of 43 midterms — the exceptions being 1934, 1998 and 2002. (Whether Republicans will pick up enough Senate seats to take control of that chamber is a much closer question.) And as Campbell concluded in his paper, “For the congressional candidates of the president’s party, the return to normalcy at the midterm represents a loss.”
