
Since the World Wide Web was conceived 25 years ago, it’s become a major reason why computers, smartphones and other data/communication technologies are integral parts of most everyone’s daily lives. Among other things, that means many more Americans are employed in developing, maintaining and improving those devices and the communications networks they use. Pinning down just how many, though, turns out to be rather tricky.
To get a sense of the Web’s impact on employment, we analyzed data from the Occupational Employment Statistics program, a joint federal-state effort to catalog the structure and compensation of the nation’s workforce. The program sorts wage and salary workers into some 800 different occupations, from CEOs to short-order cooks. Twice a year, the program collects payroll data from about 200,000 employers; each set of occupational estimates combines the six most recent semiannual panels, for a total of 1.2 million establishments. (Though, it’s important to note that the data exclude self-employed workers.)
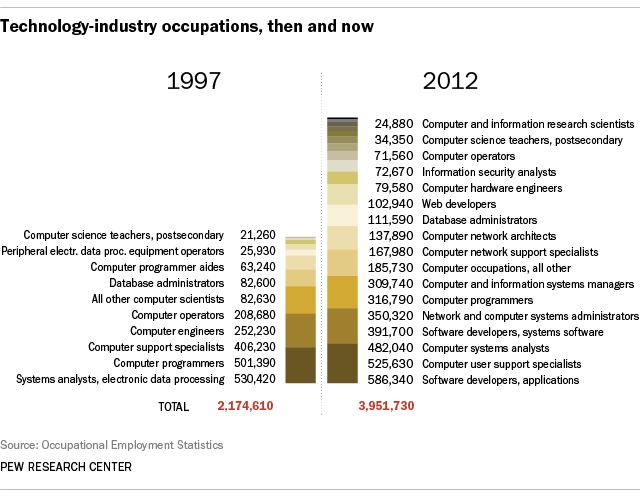
The most recent estimates, released nearly a year ago and based on data collected from November 2009 to May 2012, indicate that about 3.9 million workers — roughly 3% of the nation’s payroll workforce — work in what we might think of as “core” tech occupations — not people who simply use computing technology in their jobs, but whose jobs involve making that technology work for the rest of us. (We excluded occupations involving the installation and repair of telecommunications lines and equipment, as well as computer repairers.)
How has that workforce changed over the past 15 years? That’s harder to answer. The first year for which estimates are available across all industries is 1997, nearly a decade after the Web went live and well into the first phase of the dot-com boom. And because occupational categories and definitions have changed over the years, not all the 1997 figures can be directly compared with the 2012 ones. Nonetheless, we selected the 1997 tech-related occupational categories that are broadly comparable to the 2012 ones, and found about 2.2 million such jobs — about 1.9% of the 1997 payroll workforce.
Perhaps more interesting than the raw numbers are the occupational descriptions, which convey just how different the structure of 2012’s technology industry is from that of 15 years earlier. Some occupations, such as web developers and information security analysts, simply didn’t exist back then (at least not under those names). Others have dramatically grown (programmers/software developers, support specialists) or shrunk (computer operators).
Of course, not all database administrators or software writers work for tech companies, and such companies employ many other kinds of workers. We also looked at the May 2012 estimates of total employment in 11 technology-related industry sectors, from “computer systems design” to “electronic shopping and mail-order houses.” Combined, those sectors employed about 3.7 million people. (Due to classification changes, comparisons to 1997 weren’t possible.)
