
As Congress debates immigration reform, some political leaders and analysts have speculated that there will be “an electoral bonanza for Democrats” if the nation’s estimated 11.1 million unauthorized immigrants – three quarters of whom are Hispanics – eventually are granted the right to vote.
While there’s no way of knowing if these predictions are accurate, the data provide some insights. In 2012, the Pew Research Center’s National Survey of Latinos found that among Latino immigrants who are not U.S. citizens or legal permanent residents (and therefore likely unauthorized immigrants), some 31% identify as Democrats and just 4% as Republicans. An additional 33% say they are political independents, 16% mention some other political party and 15% say they “don’t know” or refuse to answer the question.
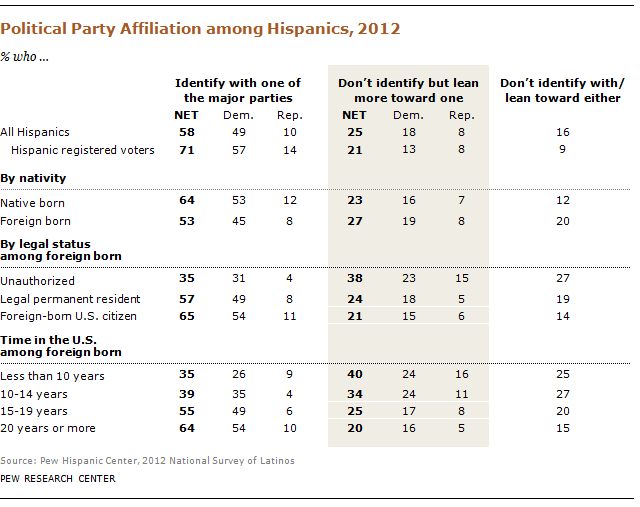
When one takes party “leaners” into account (i.e., those who don’t say they identify with one of the major parties, but in a follow-up question say they feel closer to one party than the other), about half of unauthorized Hispanic immigrants either identify with (31%) or lean towards (23%) the Democratic Party, while about two-in-ten identify with (4%) or lean towards (15%) the Republican Party. About a quarter (27%) do not identify with or lean towards either party.
Comparing unauthorized immigrant Hispanics with other Hispanic subgroups suggests that as immigrants move closer towards citizenship, it is likely that a greater share of them will identify with one of the major political parties. Our survey found that most legal permanent residents (57%) and foreign-born U.S. citizens (65%) are affiliated with one of the major parties.
Our research has also found a correlation between the amount of time Hispanic immigrants (regardless of legal status) spend in the United States and the share that identifies with a political party. While nearly two-thirds (63%) of Hispanic immigrants who have been in the U.S. at least 15 years identify with one of the two major parties, that share falls to 38% among those who have been in the U.S. for fewer than 15 years.
The predictions about how unauthorized immigrants will vote stem from the fact that among all Latino immigrants who are eligible to vote (i.e. are U.S. citizens) many more identify as Democrats than as Republicans—54% versus 11%. And in the 2012 presidential election, according to the National Election Pool, Latino voters favored Democrat Barack Obama over Republican Mitt Romney by 71%-27%. While Democratic candidates have garnered a greater share of the Hispanic vote than Republican candidates in every election over the past three decades, the gap has been narrower in some elections than others. For example, in the 2004 election the gap among Hispanic votes between John Kerry and George W. Bush was only 18 percentage points (58% vs. 40%), compared with the 44 percentage point gap in the 2012 election.
This current snapshot shows that unauthorized Hispanic immigrants also lean more Democratic than Republican—though to a lesser degree than Hispanic immigrants who are currently eligible to vote. And it’s uncertain whether these unauthorized immigrants, many of whom are currently unaffiliated, would adopt similar political affiliations and voting patterns if given the chance to naturalize.
