
Total number of abortion providers down since 1982
Number of abortion providers in U.S., by type
Note: Physicians’ offices reporting 400 or more abortions a year are classified as clinics. “Other clinics” are places where most patient visits are for services that
were not abortions.
Source: Guttmacher Institute.
PEW RESEARCH CENTER
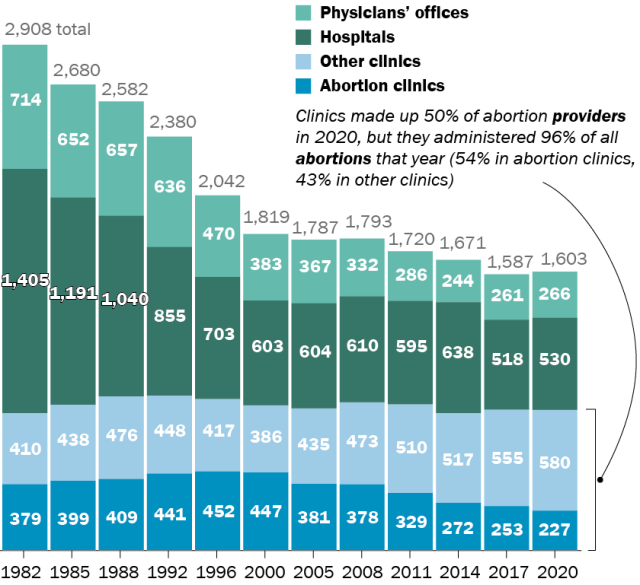
Total number of abortion providers down since 1982
Number of abortion providers in U.S., by type
| Year | Abortion clinics | Other clinics | Hospitals | Physicians’ offices |
|---|---|---|---|---|
| 1982 | 379 | 410 | 1405 | 714 |
| 1985 | 399 | 438 | 1191 | 652 |
| 1988 | 409 | 476 | 1040 | 657 |
| 1992 | 441 | 448 | 855 | 636 |
| 1996 | 452 | 417 | 703 | 470 |
| 2000 | 447 | 386 | 603 | 383 |
| 2005 | 381 | 435 | 604 | 367 |
| 2008 | 378 | 473 | 610 | 332 |
| 2011 | 329 | 510 | 595 | 286 |
| 2014 | 272 | 517 | 638 | 244 |
| 2017 | 253 | 555 | 518 | 261 |
| 2020 | 227 | 580 | 530 | 266 |
Note: Physicians’ offices reporting 400 or more abortions a year are classified as clinics. “Other clinics” are places where most patient visits are for services that
were not abortions.
Source: Guttmacher Institute.
PEW RESEARCH CENTER
