
The U.S. has the second-highest representation ratio of any democracy
Average number of people per lawmaker in the lower or sole chamber of national legislature
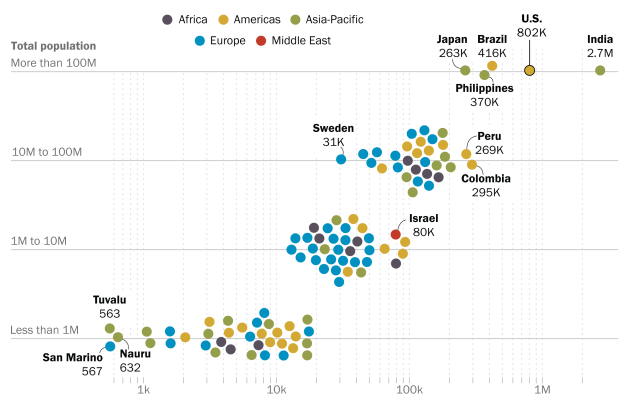
Note: Representation ratio calculated by dividing each country’s 2025 population by the current number of seats in its national legislature, or in the lower chamber of a bicameral legislature. Nonvoting members are excluded from seat counts. Data is based on 106 countries classified as democracies and includes some fully self-governing territories whose sovereign status is disputed.
Source: Pew Research Center analysis using probabilistic population projections from the UN Population Division.
PEW RESEARCH CENTER
The U.S. has the second-highest representation ratio of any democracy
Average number of people per lawmaker in the lower or sole chamber of national legislature
| Democracy | Representation ratio | Population | Region |
|---|---|---|---|
| Albania | 19650 | 2751000 | Europe |
| Andorra | 3000 | 84000 | Europe |
| Antigua and Barbuda | 5588 | 95000 | Americas |
| Argentina | 179004 | 46004000 | Americas |
| Armenia | 27393 | 2931000 | Asia-Pacific |
| Australia | 181513 | 27227000 | Asia-Pacific |
| Austria | 49765 | 9107000 | Europe |
| Bahamas | 9878 | 405000 | Americas |
| Barbados | 9433 | 283000 | Americas |
| Belgium | 78500 | 11775000 | Europe |
| Belize | 13839 | 429000 | Americas |
| Bhutan | 17064 | 802000 | Asia-Pacific |
| Bolivia | 98069 | 12749000 | Americas |
| Botswana | 40046 | 2603000 | Africa |
| Brazil | 416302 | 213563000 | Americas |
| Bulgaria | 27783 | 6668000 | Europe |
| Canada | 117983 | 40468000 | Americas |
| Cape Verde | 7361 | 530000 | Africa |
| Chile | 128684 | 19946000 | Americas |
| Colombia | 294732 | 53936000 | Americas |
| Costa Rica | 90789 | 5175000 | Americas |
| Croatia | 25311 | 3822000 | Europe |
| Cyprus | 17446 | 977000 | Asia-Pacific |
| Czech Republic | 52640 | 10528000 | Europe |
| Denmark | 33654 | 6024000 | Europe |
| Dominica | 2063 | 66000 | Americas |
| Dominican Republic | 61105 | 11610000 | Americas |
| East Timor | 22108 | 18445000 | Asia-Pacific |
| Ecuador | 122152 | 1331000 | Americas |
| Estonia | 13178 | 937000 | Europe |
| Fiji | 17036 | 5622000 | Asia-Pacific |
| Finland | 28110 | 66746000 | Europe |
| France | 115678 | 83644000 | Europe |
| Germany | 132768 | 35698000 | Europe |
| Ghana | 129341 | 9897000 | Africa |
| Greece | 32990 | 117000 | Europe |
| Grenada | 7800 | 841000 | Americas |
| Guyana | 12938 | 9586000 | Americas |
| Hungary | 48171 | 402000 | Europe |
| Iceland | 6381 | 1476626000 | Europe |
| India | 2724402 | 5357000 | Asia-Pacific |
| Ireland | 30787 | 9648000 | Europe |
| Israel | 80400 | 58926000 | Middle East |
| Italy | 147315 | 2833000 | Europe |
| Jamaica | 44968 | 122428000 | Americas |
| Japan | 263286 | 138000 | Asia-Pacific |
| Kiribati | 3067 | 1667000 | Asia-Pacific |
| Kosovo | 13892 | 1836000 | Europe |
| Latvia | 18360 | 2389000 | Europe |
| Lesotho | 19908 | 5854000 | Africa |
| Liberia | 80192 | 40000 | Africa |
| Liechtenstein | 1600 | 2797000 | Europe |
| Lithuania | 19837 | 687000 | Europe |
| Luxembourg | 11450 | 22786000 | Europe |
| Malawi | 99502 | 36385000 | Africa |
| Malaysia | 163896 | 549000 | Asia-Pacific |
| Malta | 8194 | 35000 | Europe |
| Marshall Islands | 1061 | 1265000 | Asia-Pacific |
| Mauritius | 19167 | 114000 | Africa |
| Micronesia, Federated States | 8143 | 2961000 | Asia-Pacific |
| Moldova | 29317 | 38000 | Europe |
| Monaco | 1583 | 3557000 | Europe |
| Mongolia | 28230 | 626000 | Asia-Pacific |
| Montenegro | 7728 | 3153000 | Europe |
| Namibia | 32844 | 12000 | Africa |
| Nauru | 632 | 29629000 | Asia-Pacific |
| Nepal | 107742 | 18449000 | Asia-Pacific |
| Netherlands | 122993 | 5287000 | Europe |
| New Zealand | 42984 | 1804000 | Asia-Pacific |
| North Macedonia | 15033 | 405000 | Europe |
| Northern Cyprus | 8100 | 5653000 | Asia-Pacific |
| Norway | 33450 | 18000 | Europe |
| Palau | 1125 | 4626000 | Asia-Pacific |
| Panama | 65155 | 7095000 | Americas |
| Paraguay | 88688 | 34922000 | Americas |
| Peru | 268631 | 117724000 | Americas |
| Philippines | 370201 | 37843000 | Asia-Pacific |
| Poland | 82267 | 10395000 | Europe |
| Portugal | 45196 | 18801000 | Europe |
| Romania | 56801 | 221000 | Europe |
| Samoa | 4333 | 34000 | Asia-Pacific |
| San Marino | 567 | 245000 | Europe |
| Sao Tome and Principe | 4455 | 19367000 | Africa |
| Senegal | 117376 | 135000 | Africa |
| Seychelles | 3971 | 5451000 | Africa |
| Slovakia | 36340 | 2115000 | Europe |
| Slovenia | 23500 | 858000 | Europe |
| Solomon Islands | 17160 | 65453000 | Asia-Pacific |
| South Africa | 163633 | 51600000 | Africa |
| South Korea | 172000 | 47851000 | Asia-Pacific |
| Spain | 136717 | 23348000 | Europe |
| Sri Lanka | 103769 | 47000 | Asia-Pacific |
| St. Kitts and Nevis | 3133 | 180000 | Americas |
| St. Lucia | 10588 | 99000 | Americas |
| St. Vincent and the Grenadines | 4304 | 645000 | Americas |
| Suriname | 12647 | 10701000 | Americas |
| Sweden | 30662 | 9008000 | Europe |
| Switzerland | 45040 | 23011000 | Europe |
| Taiwan | 203637 | 1437000 | Asia-Pacific |
| Tonga | 3433 | 103000 | Asia-Pacific |
| Trinidad and Tobago | 36902 | 1513000 | Americas |
| Tuvalu | 563 | 9000 | Asia-Pacific |
| United Kingdom | 107588 | 69932000 | Europe |
| United States | 802379 | 349035000 | Americas |
| Uruguay | 34172 | 3383000 | Americas |
| Vanuatu | 6596 | 343000 | Asia-Pacific |
* Population projections for the Turkish Republic of Northern Cyprus are not available from the United Nations. The projections above for Northern Cyprus and the Republic of Cyprus (the internationally recognized government that controls two-thirds of the island) were derived by splitting the projection for the entire island based on the ratio of the 2021 population estimates for the two places.
Note: Representation ratio calculated by dividing each country’s 2025 population by the current number of seats in its national legislature, or in the lower chamber of a bicameral legislature. Nonvoting members are excluded from seat counts. Data is based on 106 countries classified as democracies and includes some fully self-governing territories whose sovereign status is disputed.
Source: Pew Research Center analysis using probabilistic population projections from the UN Population Division.
PEW RESEARCH CENTER
