
The racial and ethnic composition of the U.S. electorate shifted between 2006 and 2026
% of U.S. eligible voters who are …
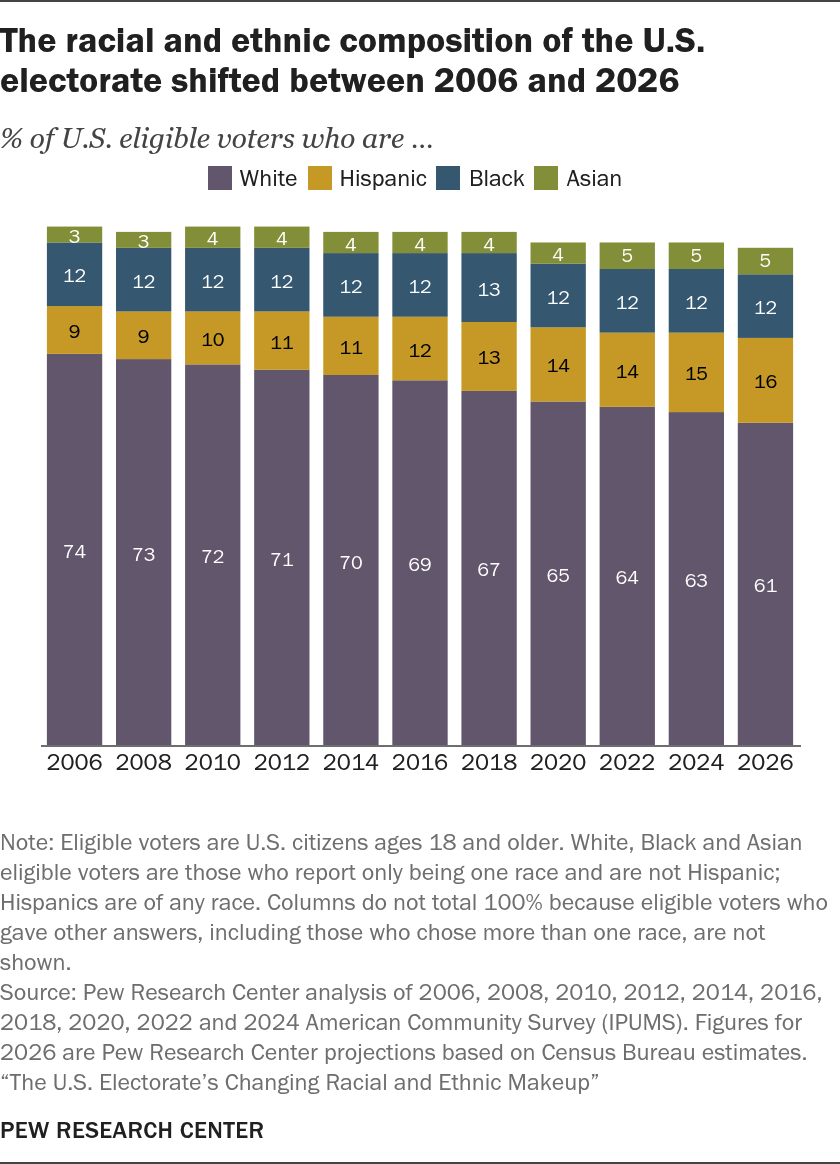
Note: Eligible voters are U.S. citizens ages 18 and older. White, Black and Asian eligible voters are those who report only being one race and are not Hispanic; Hispanics are of any race. Columns do not total 100% because eligible voters who gave other answers, including those who chose more than one race, are not shown.
Source: Pew Research Center analysis of 2006, 2008, 2010, 2012, 2014, 2016, 2018, 2020, 2022 and 2024 American Community Survey (IPUMS). Figures for 2026 are Pew Research Center projections based on Census Bureau estimates.
“The U.S. Electorate’s Changing Racial and Ethnic Makeup”
“The U.S. Electorate’s Changing Racial and Ethnic Makeup”
PEW RESEARCH CENTER
The racial and ethnic composition of the U.S. electorate shifted between 2006 and 2026
% of U.S. eligible voters who are …
| Year | White | Hispanic | Black | Asian |
|---|---|---|---|---|
| 2006 | 74 | 9 | 12 | 3 |
| 2008 | 73 | 9 | 12 | 3 |
| 2010 | 72 | 10 | 12 | 4 |
| 2012 | 71 | 11 | 12 | 4 |
| 2014 | 70 | 11 | 12 | 4 |
| 2016 | 69 | 12 | 12 | 4 |
| 2018 | 67 | 13 | 13 | 4 |
| 2020 | 65 | 14 | 12 | 4 |
| 2022 | 64 | 14 | 12 | 5 |
| 2024 | 63 | 15 | 12 | 5 |
| 2026 | 61 | 16 | 12 | 5 |
Note: Eligible voters are U.S. citizens ages 18 and older. White, Black and Asian eligible voters are those who report only being one race and are not Hispanic; Hispanics are of any race. Columns do not total 100% because eligible voters who gave other answers, including those who chose more than one race, are not shown.
Source: Pew Research Center analysis of 2006, 2008, 2010, 2012, 2014, 2016, 2018, 2020, 2022 and 2024 American Community Survey (IPUMS). Figures for 2026 are Pew Research Center projections based on Census Bureau estimates.
“The U.S. Electorate’s Changing Racial and Ethnic Makeup”
“The U.S. Electorate’s Changing Racial and Ethnic Makeup”
PEW RESEARCH CENTER

