Labor force participation
% of civilians ages 16 and older working or looking for work, by race/ethnicity
Note: Refer to the methodology for definitions and further details.
Source: Pew Research Center analysis of 1970, 1980, 1990 and 2000 decennial census, and 2010, 2019 and 2024 American Community Survey (IPUMS).
PEW RESEARCH CENTER
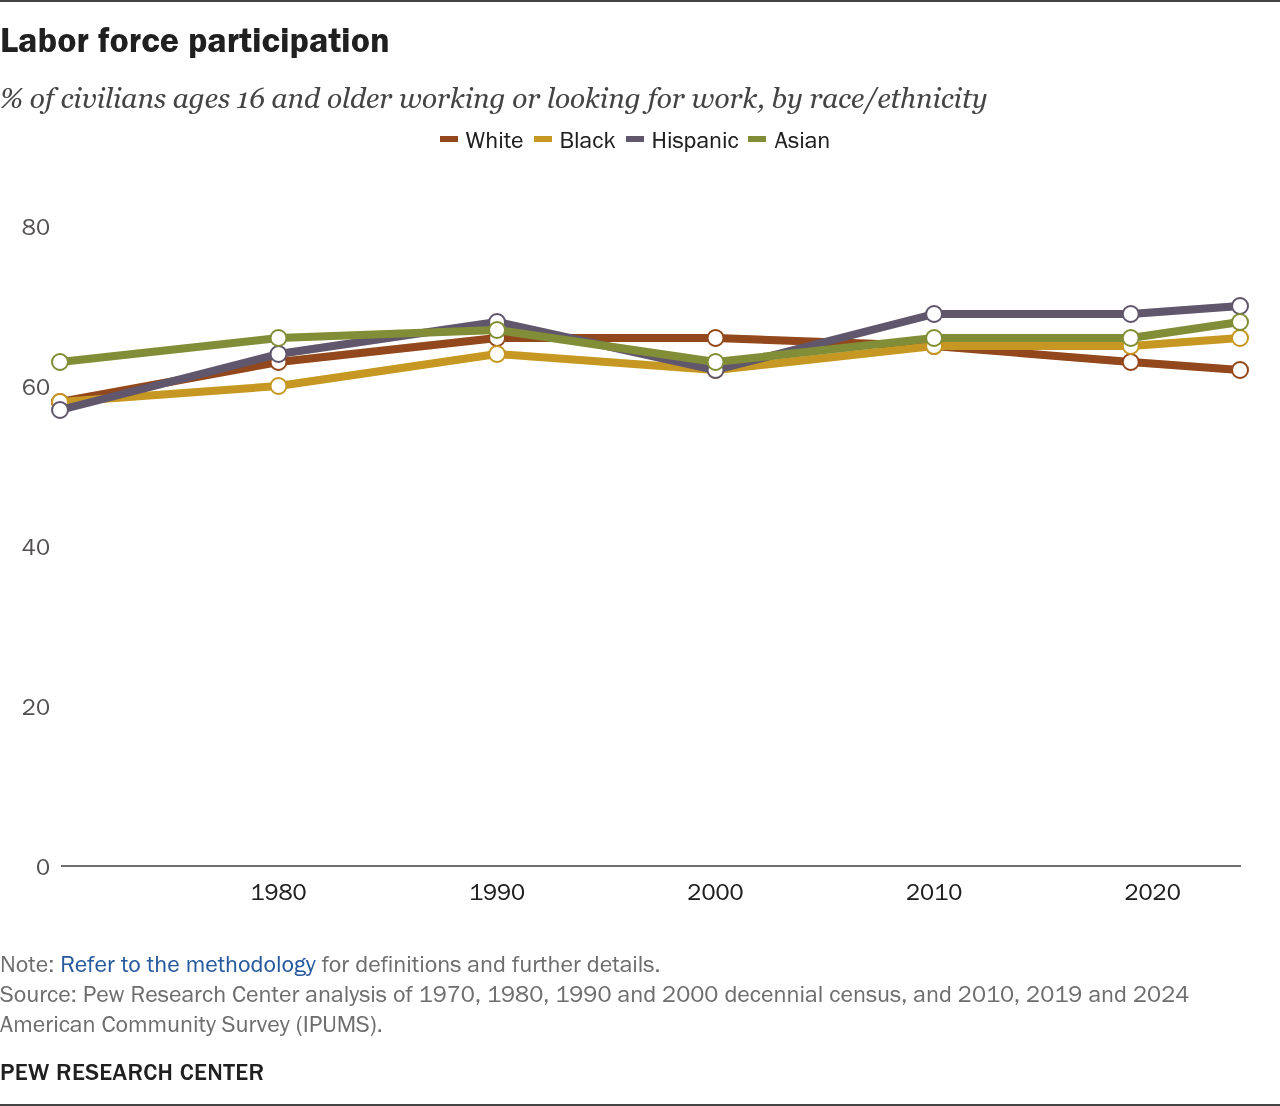
Labor force participation
% of civilians ages 16 and older working or looking for work, by race/ethnicity
| Year | White | Black | Asian | Hispanic |
|---|---|---|---|---|
| 1970 | 58% | 58% | 63% | 57% |
| 1980 | 63% | 60% | 66% | 64% |
| 1990 | 66% | 64% | 67% | 68% |
| 2000 | 66% | 62% | 63% | 62% |
| 2010 | 65% | 65% | 66% | 69% |
| 2019 | 63% | 65% | 66% | 69% |
| 2024 | 62% | 66% | 68% | 70% |
Note: Refer to the methodology for definitions and further details.
Source: Pew Research Center analysis of 1970, 1980, 1990 and 2000 decennial census, and 2010, 2019 and 2024 American Community Survey (IPUMS).
PEW RESEARCH CENTER
