
Income class
% of adults in each income tier
Note: Refer to the methodology for definitions and further details.
Source: Pew Research Center analysis of 1970, 1980, 1990 and 2000 decennial census, and 2010, 2019 and 2024 American Community Survey (IPUMS).
PEW RESEARCH CENTER
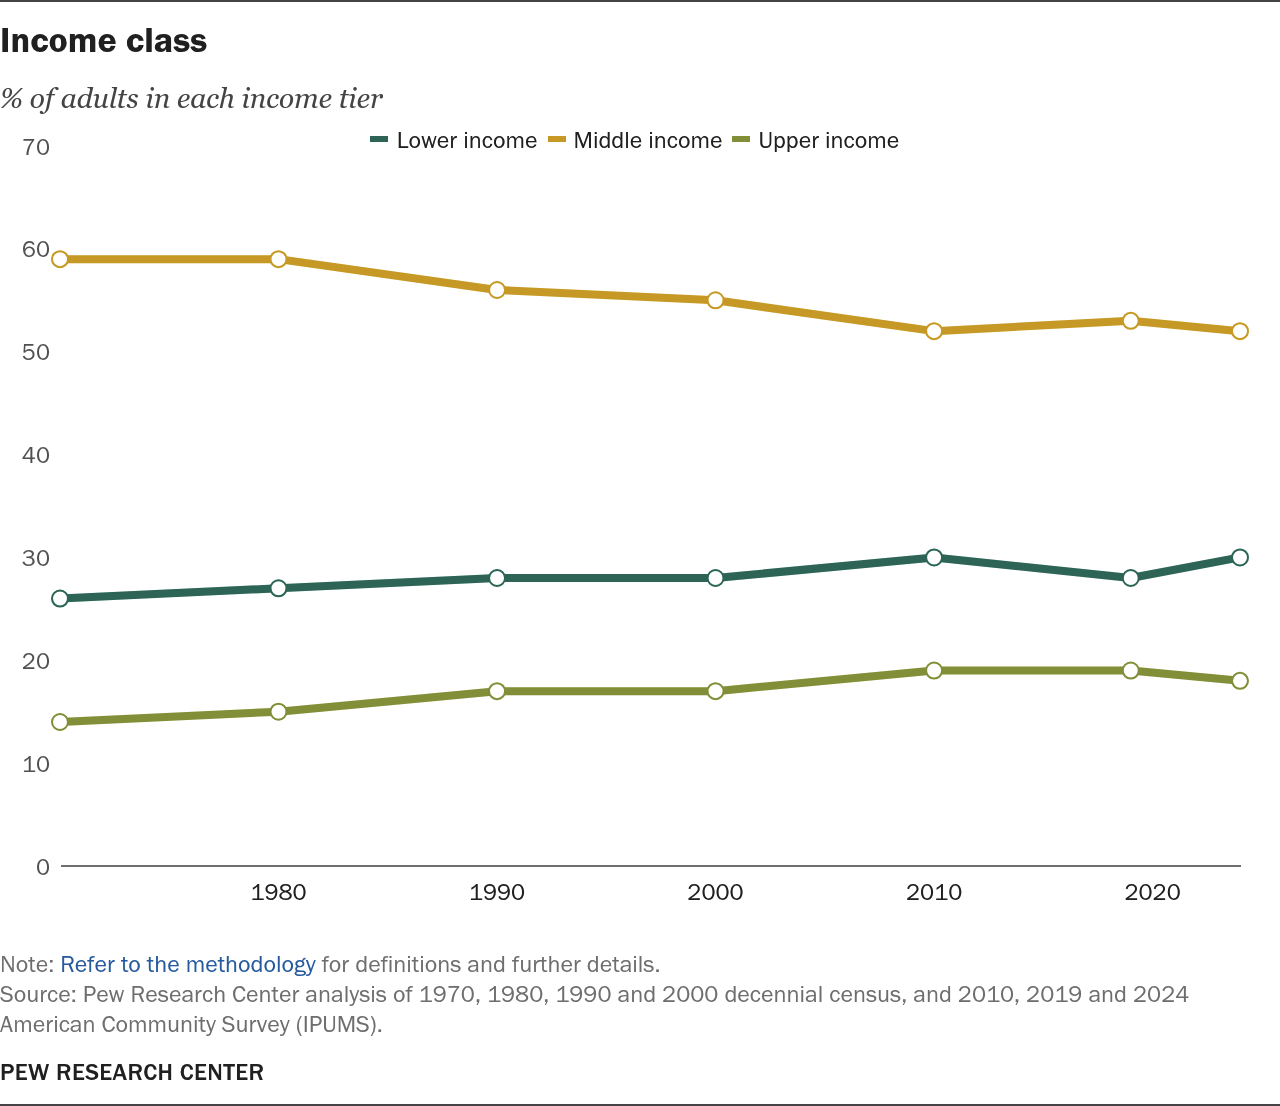
Income class
% of adults in each income tier
| Year | Lower income | Middle income | Upper income |
|---|---|---|---|
| 1970 | 26% | 59% | 14% |
| 1980 | 27% | 59% | 15% |
| 1990 | 28% | 56% | 17% |
| 2000 | 28% | 55% | 17% |
| 2010 | 30% | 52% | 19% |
| 2019 | 28% | 53% | 19% |
| 2024 | 30% | 52% | 18% |
Note: Refer to the methodology for definitions and further details.
Source: Pew Research Center analysis of 1970, 1980, 1990 and 2000 decennial census, and 2010, 2019 and 2024 American Community Survey (IPUMS).
PEW RESEARCH CENTER
