
Education
% of adults ages 25 and older who completed at least a bachelor’s degree, by gender
Note: Refer to the methodology for definitions and further details.
Source: Pew Research Center analysis of 1970, 1980, 1990 and 2000 decennial census, and 2010, 2019 and 2024 American Community Survey (IPUMS).
PEW RESEARCH CENTER
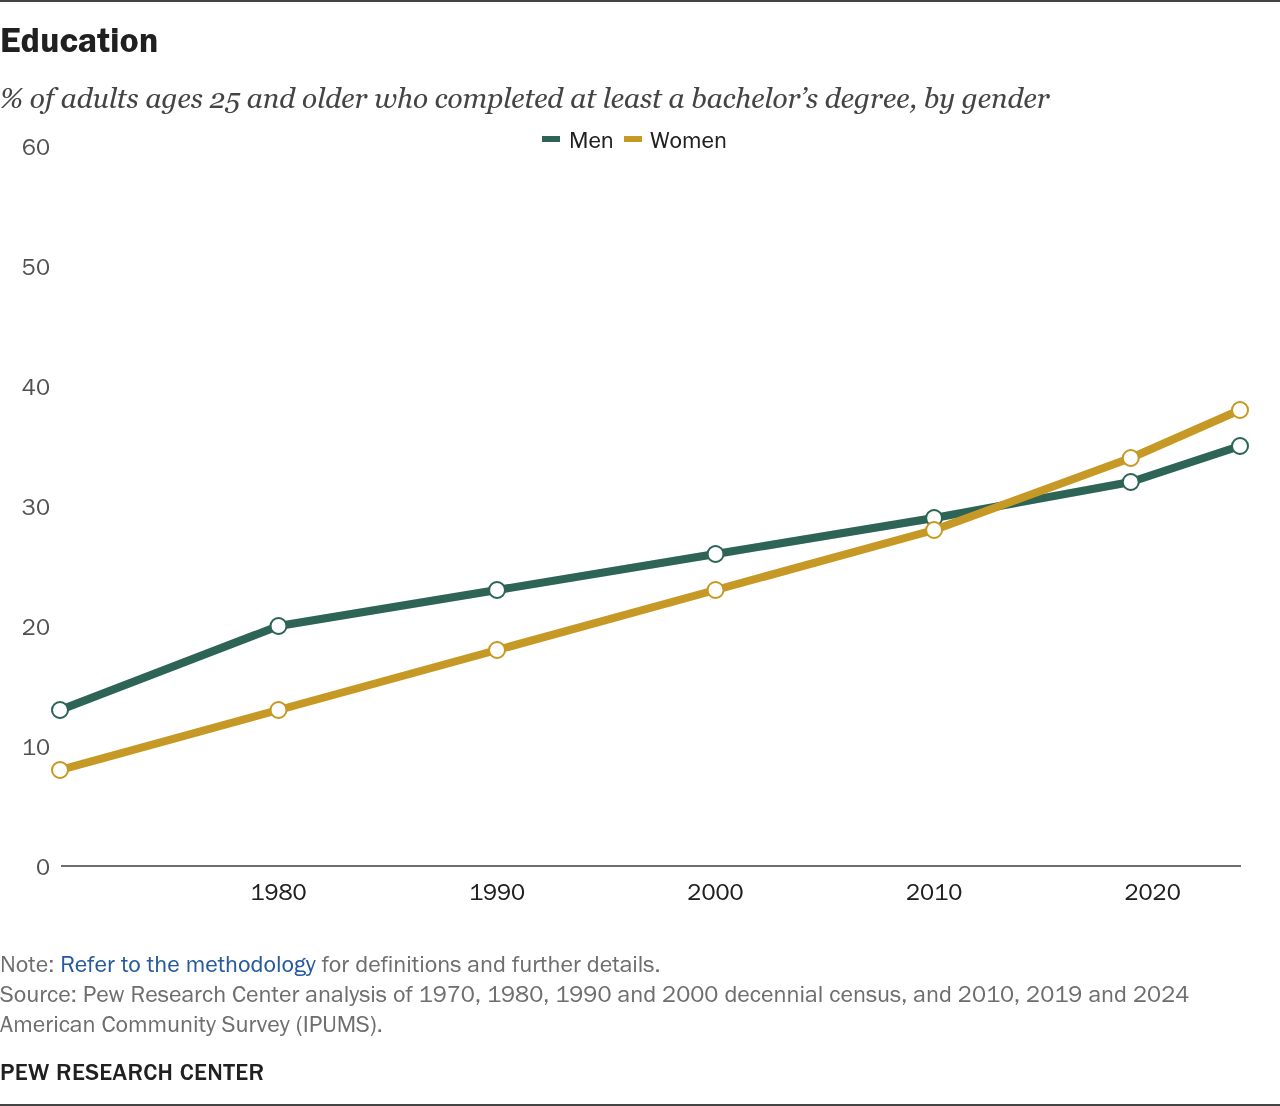
Education
% of adults ages 25 and older who completed at least a bachelor’s degree, by gender
| Year | Men | Women |
|---|---|---|
| 1970 | 13% | 8% |
| 1980 | 20% | 13% |
| 1990 | 23% | 18% |
| 2000 | 26% | 23% |
| 2010 | 29% | 28% |
| 2019 | 32% | 34% |
| 2024 | 35% | 38% |
Note: Refer to the methodology for definitions and further details.
Source: Pew Research Center analysis of 1970, 1980, 1990 and 2000 decennial census, and 2010, 2019 and 2024 American Community Survey (IPUMS).
PEW RESEARCH CENTER
