
U.S. share of global crude oil market is at its highest point since 1980s
% of global crude oil and lease condensate production
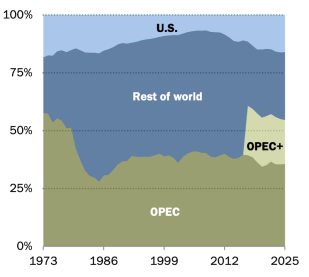
Note: OPEC+ figures do not include Sudan due to data limitations. In early 2025, Brazil joined the OPEC+ partners as a participant, not a member, and is excluded from the OPEC+ production figures.
Source: Pew Research Center analysis of U.S. Energy Information Administration data.
PEW RESEARCH CENTER
U.S. share of global crude oil market is at its highest point since 1980s
% of global crude oil and lease condensate production
| Year | OPEC | OPEC+ | Rest of world | U.S. |
|---|---|---|---|---|
| 1973 | 57.7% | 0.0% | 24.0% | 18.3% |
| 1974 | 57.3% | 0.0% | 25.2% | 17.4% |
| 1975 | 53.5% | 0.0% | 28.9% | 17.6% |
| 1976 | 55.5% | 0.0% | 28.8% | 15.7% |
| 1977 | 54.2% | 0.0% | 30.5% | 15.3% |
| 1978 | 51.1% | 0.0% | 32.9% | 16.0% |
| 1979 | 51.0% | 0.0% | 33.9% | 15.1% |
| 1980 | 41.9% | 0.0% | 43.7% | 14.4% |
| 1981 | 37.0% | 0.0% | 47.7% | 15.3% |
| 1982 | 32.7% | 0.0% | 51.1% | 16.2% |
| 1983 | 30.6% | 0.0% | 53.1% | 16.3% |
| 1984 | 29.6% | 0.0% | 54.1% | 16.3% |
| 1985 | 27.9% | 0.0% | 55.4% | 16.6% |
| 1986 | 30.7% | 0.0% | 53.9% | 15.4% |
| 1987 | 31.0% | 0.0% | 54.3% | 14.7% |
| 1988 | 33.0% | 0.0% | 53.1% | 13.9% |
| 1989 | 35.3% | 0.0% | 52.0% | 12.7% |
| 1990 | 36.8% | 0.0% | 51.1% | 12.2% |
| 1991 | 36.9% | 0.0% | 50.8% | 12.3% |
| 1992 | 39.0% | 0.0% | 49.0% | 11.9% |
| 1993 | 38.7% | 0.0% | 49.6% | 11.7% |
| 1994 | 38.6% | 0.0% | 50.4% | 11.0% |
| 1995 | 38.8% | 0.0% | 50.6% | 10.7% |
| 1996 | 38.7% | 0.0% | 51.0% | 10.3% |
| 1997 | 39.4% | 0.0% | 50.7% | 9.9% |
| 1998 | 40.0% | 0.0% | 50.5% | 9.5% |
| 1999 | 38.9% | 0.0% | 52.0% | 9.1% |
| 2000 | 39.2% | 0.0% | 52.0% | 8.8% |
| 2001 | 38.3% | 0.0% | 52.9% | 8.7% |
| 2002 | 36.1% | 0.0% | 55.1% | 8.7% |
| 2003 | 38.7% | 0.0% | 53.3% | 8.0% |
| 2004 | 40.1% | 0.0% | 52.5% | 7.5% |
| 2005 | 40.9% | 0.0% | 52.1% | 7.0% |
| 2006 | 41.0% | 0.0% | 52.1% | 6.9% |
| 2007 | 40.4% | 0.0% | 52.8% | 6.8% |
| 2008 | 40.4% | 0.0% | 52.9% | 6.7% |
| 2009 | 38.8% | 0.0% | 53.9% | 7.3% |
| 2010 | 38.6% | 0.0% | 54.1% | 7.4% |
| 2011 | 39.3% | 0.0% | 53.2% | 7.5% |
| 2012 | 40.0% | 0.0% | 51.5% | 8.5% |
| 2013 | 38.6% | 0.0% | 51.6% | 9.8% |
| 2014 | 37.8% | 0.0% | 51.0% | 11.2% |
| 2015 | 38.2% | 0.0% | 50.1% | 11.7% |
| 2016 | 39.5% | 0.0% | 49.6% | 10.9% |
| 2017 | 39.4% | 21.3% | 27.7% | 11.5% |
| 2018 | 38.5% | 21.0% | 27.3% | 13.2% |
| 2019 | 36.3% | 21.1% | 27.7% | 14.9% |
| 2020 | 34.4% | 21.2% | 29.5% | 14.9% |
| 2021 | 35.1% | 21.2% | 29.0% | 14.7% |
| 2022 | 36.6% | 20.5% | 28.0% | 14.8% |
| 2023 | 35.5% | 20.4% | 28.4% | 15.8% |
| 2024 | 35.5% | 19.5% | 28.9% | 16.2% |
| 2025 | 35.5% | 19.2% | 29.2% | 16.1% |
Note: OPEC+ figures do not include Sudan due to data limitations. In early 2025, Brazil joined the OPEC+ partners as a participant, not a member, and is excluded from the OPEC+ production figures.
Source: Pew Research Center analysis of U.S. Energy Information Administration data.
PEW RESEARCH CENTER
