
Partisanship among Native Hawaiian or Pacific Islander adults
% who, in 2023-24, identified as …
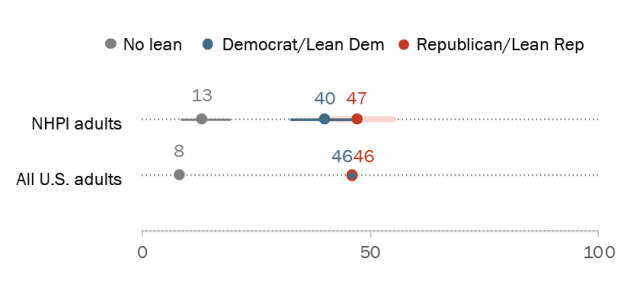
Note: Native Hawaiian or Pacific Islander adults are people living in the 50 U.S. states or D.C. who self-identify as Native Hawaiian or Pacific Islander, alone or in combination with other races or Hispanic ethnicity. The lines surrounding the data points show the error bar for each estimate.
Source: Religious Landscape Study of U.S. adults conducted July 17, 2023-March 4, 2024.
PEW RESEARCH CENTER
Partisanship among Native Hawaiian or Pacific Islander adults
% who, in 2023-24, identified as …
| Group | No lean | No lean lower | No lean upper | Rep/Lean Rep | Rep/Lean Rep lower | Rep/Lean Rep upper | Dem/Lean Dem | Dem/Lean Dem lower | Dem/Lean Dem upper |
|---|---|---|---|---|---|---|---|---|---|
| NHPI adults | 12.7 | 8.3 | 19.0 | 47.2 | 39.3 | 55.2 | 40.1 | 32.7 | 48.0 |
| All U.S. adults | 7.6 | 7.5 | 7.7 | 46.2 | 46.0 | 46.5 | 46.2 | 46.0 | 46.5 |
Note: Native Hawaiian or Pacific Islander adults are people living in the 50 U.S. states or D.C. who self-identify as Native Hawaiian or Pacific Islander, alone or in combination with other races or Hispanic ethnicity. The lines surrounding the data points show the error bar for each estimate.
Source: Religious Landscape Study of U.S. adults conducted July 17, 2023-March 4, 2024.
PEW RESEARCH CENTER
