
Partisan gap in presidential approval is wider now than in past decades
% who approve of president’s job performance, by party (yearly averages)
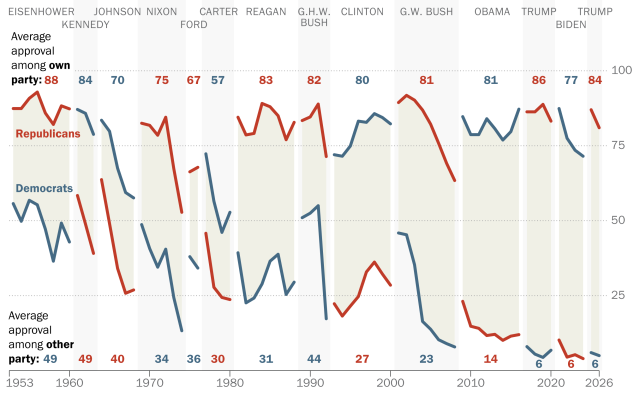
Note: Lines show yearly approval averages; data labels show administration averages. Because some earlier data did not include partisan leaning, Republicans and Democrats in this graphic do not include those who lean to each party. Yearly averages for Johnson and Ford begin when they first take office (November 1963 and August 1974, respectively); their final years in office end at the end of their term (January 1969 and January 1977, respectively).
Source: Annual totals of survey data from Pew Research Center American Trends Panel (2017-2026), Pew Research Center phone surveys (1993-2017) and Gallup organization (1953-1993).
Source: Annual totals of survey data from Pew Research Center American Trends Panel (2017-2026), Pew Research Center phone surveys (1993-2017) and Gallup organization (1953-1993).
PEW RESEARCH CENTER
Partisan gap in presidential approval is wider now than in past decades
% who approve of president’s job performance, by party (yearly averages)
| President | Year in office | Dates | Start date | Rep | Dem |
|---|---|---|---|---|---|
| Eisenhower | 1 | Jan ’53-Jan ’54 | 1/20/53 | 87.4 | 55.7 |
| Eisenhower | 2 | Jan ’54-Jan ’55 | 1/20/54 | 87.4 | 49.8 |
| Eisenhower | 3 | Jan ’55-Jan ’56 | 1/20/55 | 90.8 | 56.8 |
| Eisenhower | 4 | Jan ’56-Jan ’57 | 1/20/56 | 92.9 | 55.3 |
| Eisenhower | 5 | Jan ’57-Jan ’58 | 1/20/57 | 85.9 | 47.2 |
| Eisenhower | 6 | Jan ’58-Jan ’59 | 1/20/58 | 82.1 | 36.5 |
| Eisenhower | 7 | Jan ’59-Jan ’60 | 1/20/59 | 88.3 | 49.2 |
| Eisenhower | 8 | Jan ’60-Jan ’61 | 1/20/60 | 87.3 | 42.9 |
| Kennedy | 1 | Jan ’61-Jan ’62 | 1/20/61 | 58.4 | 87.1 |
| Kennedy | 2 | Jan ’62-Jan ’63 | 1/20/62 | 48.9 | 85.8 |
| Kennedy | 3 | Jan ’63-Nov ’63 | 1/20/63 | 39.1 | 78.8 |
| Johnson | 1 | Nov ’63-Nov ’64 | 11/22/63 | 63.7 | 83.5 |
| Johnson | 2 | Nov ’64-Nov ’65 | 11/22/64 | 49 | 79.8 |
| Johnson | 3 | Nov ’65-Nov ’66 | 11/22/65 | 34.1 | 67.5 |
| Johnson | 4 | Nov ’66-Nov ’67 | 11/22/66 | 25.8 | 59.4 |
| Johnson | 5 | Nov ’67-Jan ’69 | 11/22/67 | 26.9 | 57.6 |
| Nixon | 1 | Jan ’69-Jan ’70 | 1/20/69 | 82.5 | 48.7 |
| Nixon | 2 | Jan ’70-Jan ’71 | 1/20/70 | 81.8 | 40.7 |
| Nixon | 3 | Jan ’71-Jan ’72 | 1/20/71 | 78.5 | 34.5 |
| Nixon | 4 | Jan ’72-Jan ’73 | 1/20/72 | 84.5 | 40.5 |
| Nixon | 5 | Jan ’73-Jan ’74 | 1/20/73 | 67.4 | 24.4 |
| Nixon | 6 | Jan ’74-Aug ’74 | 1/20/74 | 52.8 | 13.3 |
| Ford | 1 | Aug ’74-Aug ’75 | 8/9/74 | 66.3 | 38 |
| Ford | 2 | Aug ’75-Jan ’77 | 8/9/75 | 67.8 | 34.2 |
| Carter | 1 | Jan ’77-Jan ’78 | 1/20/77 | 45.8 | 72.3 |
| Carter | 2 | Jan ’78-Jan ’79 | 1/20/78 | 27.8 | 56.5 |
| Carter | 3 | Jan ’79-Jan ’80 | 1/20/79 | 24.4 | 46.1 |
| Carter | 4 | Jan ’80-Jan ’81 | 1/20/80 | 23.7 | 52.8 |
| Reagan | 1 | Jan ’81-Jan ’82 | 1/20/81 | 84.5 | 39.3 |
| Reagan | 2 | Jan ’82-Jan ’83 | 1/20/82 | 78.6 | 22.6 |
| Reagan | 3 | Jan ’83-Jan ’84 | 1/20/83 | 79.1 | 24.2 |
| Reagan | 4 | Jan ’84-Jan ’85 | 1/20/84 | 89.1 | 28.9 |
| Reagan | 5 | Jan ’85-Jan ’86 | 1/20/85 | 88 | 36.5 |
| Reagan | 6 | Jan ’86-Jan ’87 | 1/20/86 | 85 | 38.8 |
| Reagan | 7 | Jan ’87-Jan ’88 | 1/20/87 | 77 | 25.4 |
| Reagan | 8 | Jan ’88-Jan ’89 | 1/20/88 | 82.8 | 29.5 |
| G.H.W. Bush | 1 | Jan ’89-Jan ’90 | 1/20/89 | 83.4 | 51 |
| G.H.W. Bush | 2 | Jan ’90-Jan ’91 | 1/20/90 | 84.6 | 52.5 |
| G.H.W. Bush | 3 | Jan ’91-Jan ’92 | 1/20/91 | 88.9 | 55 |
| G.H.W. Bush | 4 | Jan ’92-Jan ’93 | 1/20/92 | 71.4 | 17.3 |
| Clinton | 1 | Jan ’93-Jan ’94 | 1/20/93 | 22.3 | 72 |
| Clinton | 2 | Jan ’94-Jan ’95 | 1/20/94 | 18.2 | 71.5 |
| Clinton | 3 | Jan ’95-Jan ’96 | 1/20/95 | 21.5 | 74.9 |
| Clinton | 4 | Jan ’96-Jan ’97 | 1/20/96 | 24.7 | 83.2 |
| Clinton | 5 | Jan ’97-Jan ’98 | 1/20/97 | 32.9 | 82.8 |
| Clinton | 6 | Jan ’98-Jan ’99 | 1/20/98 | 36.2 | 85.7 |
| Clinton | 7 | Jan ’99-Jan ’00 | 1/20/99 | 32.2 | 84.4 |
| Clinton | 8 | Jan ’00-Jan ’01 | 1/20/00 | 28.5 | 82.3 |
| G.W. Bush | 1 | Jan ’01-Jan ’02 | 1/20/01 | 89.4 | 45.9 |
| G.W. Bush | 2 | Jan ’02-Jan ’03 | 1/20/02 | 91.8 | 45.3 |
| G.W. Bush | 3 | Jan ’03-Jan ’04 | 1/20/03 | 90.2 | 35.3 |
| G.W. Bush | 4 | Jan ’04-Jan ’05 | 1/20/04 | 86.9 | 16.4 |
| G.W. Bush | 5 | Jan ’05-Jan ’06 | 1/20/05 | 82.2 | 13.8 |
| G.W. Bush | 6 | Jan ’06-Jan ’07 | 1/20/06 | 75.8 | 10.3 |
| G.W. Bush | 7 | Jan ’07-Jan ’08 | 1/20/07 | 69.1 | 9 |
| G.W. Bush | 8 | Jan ’08-Jan ’09 | 1/20/08 | 63.4 | 7.9 |
| Obama | 1 | Jan ’09-Jan ’10 | 1/20/09 | 23.1 | 84.7 |
| Obama | 2 | Jan ’10-Jan ’11 | 1/20/10 | 14.8 | 78.7 |
| Obama | 3 | Jan ’11-Jan ’12 | 1/20/11 | 14.1 | 78.7 |
| Obama | 4 | Jan ’12-Jan ’13 | 1/20/12 | 11.7 | 84 |
| Obama | 5 | Jan ’13-Dec ’13 | 1/20/13 | 12.1 | 80.7 |
| Obama | 6 | Jan ’14-Dec ’14 | 1/20/14 | 10.1 | 76.9 |
| Obama | 7 | Jan ’15-Dec ’15 | 1/20/15 | 11.5 | 79.7 |
| Obama | 8 | Jan ’16-Jan ’17 | 1/20/16 | 12 | 87.2 |
| Trump | 1 | Jan ’17-Dec ’17 | 1/20/17 | 86.3 | 8 |
| Trump | 2 | Jan ’18-Jan ’19 | 1/20/18 | 86.3 | 5.5 |
| Trump | 3 | Feb ’19-Jan ’20 | 1/20/19 | 88.8 | 4.4 |
| Trump | 4 | Feb ’20-Aug ‘2020 | 1/20/20 | 83.2 | 6.8 |
| Biden | 1 | Mar ’21-Jan ’22 | 1/20/21 | 10.2 | 87.4 |
| Biden | 2 | Mar ’22-October ’22 | 1/20/22 | 4.5 | 77.5 |
| Biden | 3 | Jan ’23-Dec ’23 | 1/20/23 | 5.3 | 73.5 |
| Biden | 4 | Jan ’24-Oct ’24 | 1/20/24 | 4 | 71.5 |
| Trump | 1 | Feb ’25-Sep ’25 | 1/20/25 | 87 | 6 |
| Trump | 2 | Feb ’26-Jul ’26 | 1/20/26 | 81 | 5 |
Note: Lines show yearly approval averages; data labels show administration averages. Because some earlier data did not include partisan leaning, Republicans and Democrats in this graphic do not include those who lean to each party. Yearly averages for Johnson and Ford begin when they first take office (November 1963 and August 1974, respectively); their final years in office end at the end of their term (January 1969 and January 1977, respectively).
Source: Annual totals of survey data from Pew Research Center American Trends Panel (2017-2026), Pew Research Center phone surveys (1993-2017) and Gallup organization (1953-1993).
Source: Annual totals of survey data from Pew Research Center American Trends Panel (2017-2026), Pew Research Center phone surveys (1993-2017) and Gallup organization (1953-1993).
PEW RESEARCH CENTER
