
Overall changes in global restrictions on religion in 2023
Changes on the Government Restrictions Index (GRI) or Social Hostilities Index (SHI) from 2022 to 2023
Note: Categories of overall change in restrictions are calculated by comparing a country’s unrounded scores on the GRI and SHI from year to year. When a country’s score on both indexes changed in the same direction (both increased or both decreased), the greater amount of change determined the category. For instance, if the country’s GRI score increased by 0.8 points and its SHI score increased by 1.5 points, the country was put into the “1.0 to 1.9 increase” category. When a country’s score increased on one index but decreased on the other, the difference between the amounts of change determined the grouping. For example, if the country’s GRI score increased by 2.0 points and its SHI score decreased by 1.5 points, the country went into the “O.1 to 0.9 increase” category. When a country’s score on one index stayed the same, the amount of change on the other index was used to assign the category. Figures may not add to 100% or to subtotals indicated due to rounding.
Source: Pew Research Center analysis of external data. Refer to the Methodology for details.
“More Countries Had Elevated Levels of Social Hostilities Involving Religion in 2023”
“More Countries Had Elevated Levels of Social Hostilities Involving Religion in 2023”
PEW RESEARCH CENTER
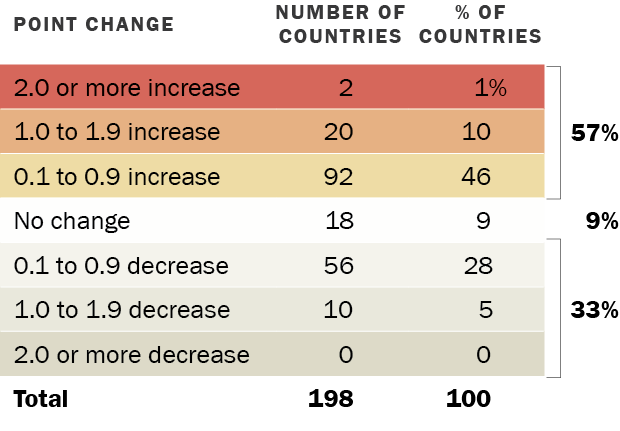
Overall changes in global restrictions on religion in 2023
Changes on the Government Restrictions Index (GRI) or Social Hostilities Index (SHI) from 2022 to 2023
| Point change | Number of countries | % of countries |
|---|---|---|
| 2.0 or more increase | 2 | 1% |
| 1.0 to 1.9 increase | 20 | 10% |
| 0.1 to 0.9 increase | 92 | 46% |
| No change | 18 | 9% |
| 0.1 to 0.9 decrease | 56 | 28% |
| 1.0 to 1.9 decrease | 10 | 5% |
| 2.0 or more decrease | 0 | 0% |
| Total | 198 | 100% |
Note: Categories of overall change in restrictions are calculated by comparing a country’s unrounded scores on the GRI and SHI from year to year. When a country’s score on both indexes changed in the same direction (both increased or both decreased), the greater amount of change determined the category. For instance, if the country’s GRI score increased by 0.8 points and its SHI score increased by 1.5 points, the country was put into the “1.0 to 1.9 increase” category. When a country’s score increased on one index but decreased on the other, the difference between the amounts of change determined the grouping. For example, if the country’s GRI score increased by 2.0 points and its SHI score decreased by 1.5 points, the country went into the “O.1 to 0.9 increase” category. When a country’s score on one index stayed the same, the amount of change on the other index was used to assign the category. Figures may not add to 100% or to subtotals indicated due to rounding.
Source: Pew Research Center analysis of external data. Refer to the Methodology for details.
“More Countries Had Elevated Levels of Social Hostilities Involving Religion in 2023”
“More Countries Had Elevated Levels of Social Hostilities Involving Religion in 2023”
PEW RESEARCH CENTER
