
Midterm vote preferences in key demographic groups
% of registered voters who say that if the election were held today, they would vote for the __ for U.S. House of Representatives in their district
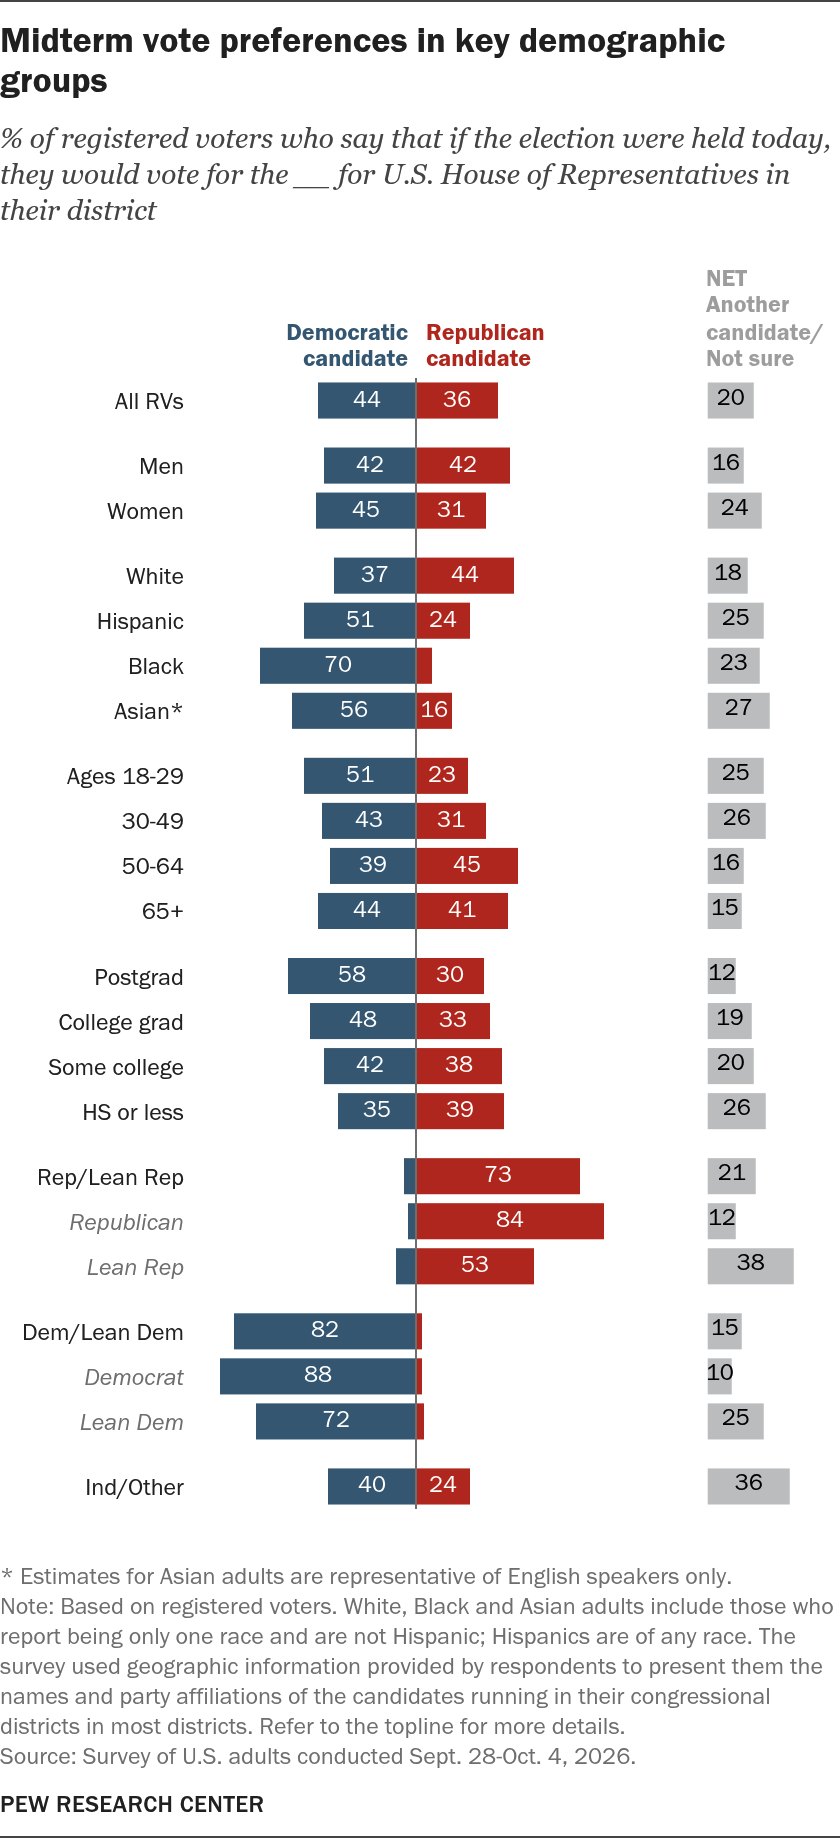
* Estimates for Asian adults are representative of English speakers only.
Note: Based on registered voters. White, Black and Asian adults include those who report being only one race and are not Hispanic; Hispanics are of any race. The survey used geographic information provided by respondents to present them the names and party affiliations of the candidates running in their congressional districts in most districts. Refer to the topline for more details.
Source: Survey of U.S. adults conducted Sept. 28-Oct. 4, 2026.
PEW RESEARCH CENTER
Midterm vote preferences in key demographic groups
% of registered voters who say that if the election were held today, they would vote for the __ for U.S. House of Representatives in their district
| Group | Democratic candidate | Republican candidate | Another candidate | Not sure | NET Another candidate/Not sure | Group |
|---|---|---|---|---|---|---|
| All RVs | 44 | 36 | 5 | 15 | 20 | total |
| Men | 42 | 42 | 4 | 12 | 16 | gender |
| Women | 45 | 31 | 5 | 19 | 24 | gender |
| White | 37 | 44 | 4 | 14 | 18 | race |
| Hispanic | 51 | 24 | 7 | 18 | 25 | race |
| Black | 70 | 7 | 6 | 17 | 23 | race |
| Asian* | 56 | 16 | 5 | 23 | 27 | race |
| Ages 18-29 | 51 | 23 | 4 | 21 | 25 | age |
| 30-49 | 43 | 31 | 6 | 20 | 26 | age |
| 50-64 | 39 | 45 | 4 | 12 | 16 | age |
| 65+ | 44 | 41 | 5 | 10 | 15 | age |
| Postgrad | 58 | 30 | 3 | 9 | 12 | ed |
| College grad | 48 | 33 | 4 | 15 | 19 | ed |
| Some college | 42 | 38 | 5 | 15 | 20 | ed |
| HS or less | 35 | 39 | 6 | 20 | 26 | ed |
| Rep/Lean Rep | 6 | 73 | 5 | 15 | 21 | rep |
| Republican | 4 | 84 | 3 | 9 | 12 | rep |
| Lean Rep | 9 | 53 | 9 | 28 | 38 | rep |
| Dem/Lean Dem | 82 | 2 | 3 | 12 | 15 | dem |
| Democrat | 88 | 2 | 2 | 8 | 10 | dem |
| Lean Dem | 72 | 3 | 6 | 19 | 25 | dem |
| Ind/Other | 40 | 24 | 8 | 27 | 36 | other |
* Estimates for Asian adults are representative of English speakers only.
Note: Based on registered voters. White, Black and Asian adults include those who report being only one race and are not Hispanic; Hispanics are of any race. The survey used geographic information provided by respondents to present them the names and party affiliations of the candidates running in their congressional districts in most districts. Refer to the topline for more details.
Source: Survey of U.S. adults conducted Sept. 28-Oct. 4, 2026.
PEW RESEARCH CENTER
